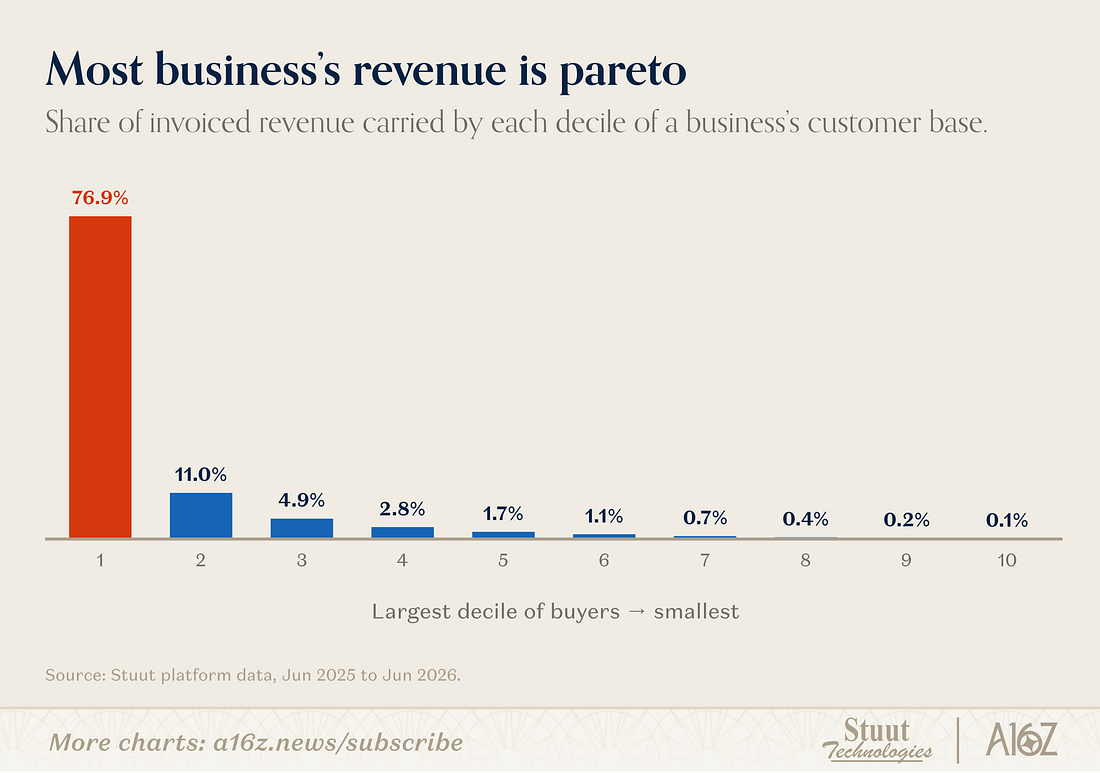
Look at that chart: the tallest red bar is practically screaming at you. The top 10% of customers are responsible for 76.9% of revenue, while the other nine deciles peck away at tiny slivers. If you’re spreading your time evenly across all customers, this image is your intervention. It’s proof you should unapologetically double down on your top decile.
How to double down on top‑decile customers
Identify the top 10% by total dollars spent, not by follower count or engagement. Interview them, ask why they chose you, and what else they wish you sold. Build VIP pricing, faster support, and tailored offers directly around their answers. Then design your marketing to find more people who look exactly like them, instead of trying to drag the bottom deciles uphill.
The psychology behind the chart
- Your top decile already proved they buy, so every improvement to their experience multiplies fast.
- The long, flat tail shows most customers are nice for vanity metrics, but nearly useless for revenue.
- Focusing on whales lets you simplify: fewer people to talk to, more money per conversation.
- Optimizing for the 90% feels fair, but the image shows it’s financially irrational.
Real-world moves based on the Pareto pattern

Shopify introduces higher-tier Shopify Plus plans because their largest merchants generated the majority of platform GMV and demanded premium features.
HubSpot launches enterprise hubs and dedicated account managers after discovering a small set of power users drove a disproportionate chunk of recurring revenue.
Creative Variations
Analyzed by Swipebot
Loading analysis...