
The $163 Trillion Pie: Who Really Owns America's Wealth
This chart by Visual Capitalist turns a dry wealth report into a pie that literally shows who’s eating best. Each...

Barry’s “Friends with Benefits” Campaign Turns a Referral into a Flirty Hookup
Barry’s took a tired referral idea and made it spicy. Their campaign line “Hookups have their benefits” instantly grabs attention...

The Marketing Power of a Simple 2x2 Grid
Riverside made a chart that every podcast creator secretly wanted: a visual map showing mics by price and sound quality....

Hampton’s “Wall of Fame” Turns Testimonials Into Trust Machines
Most brands treat testimonials like museum pieces. Hampton turned theirs into a party feed. The “Wall of Fame” shows real...
Over the past 20 years, if you just stayed in the market, you made about 10% a year, which means your money doubles every 7 years.
If you missed the best 10 days, you cut your returns in half to 5%.
Miss the best 20? You basically...
Harnessing the Power of Consistency in Investing
Sam Parr dropped a killer tweet about investing: stay in the market and you’ll get around 10% per year. Miss...

GoHighLevel graphic shows what companies they replace
This image nails what every SaaS founder dreams of showing: one clean funnel replacing a messy pile of disconnected software...

Faucet Ads - Focusing on Trust
This Moen faucet campaign is a masterclass in building authority through visuals. Instead of shouting “we’re the best,” Moen shows...
I think if your plan on getting rich is selling your company...you're gonna have a bad time.
Its SO rare.
Caught up the other day with a founder that had an M&A offer that would have made him $130,000,000 in 2022
Today, they can’t raise another round and are a bit stuck
Just a reminder how thin liquidity is in 99% of start-ups
It’s...
The Reality of Getting Rich by Selling Your Company
Most founders daydream about selling their company for millions. Sam Parr’s tweet hits that dream with a splash of cold...
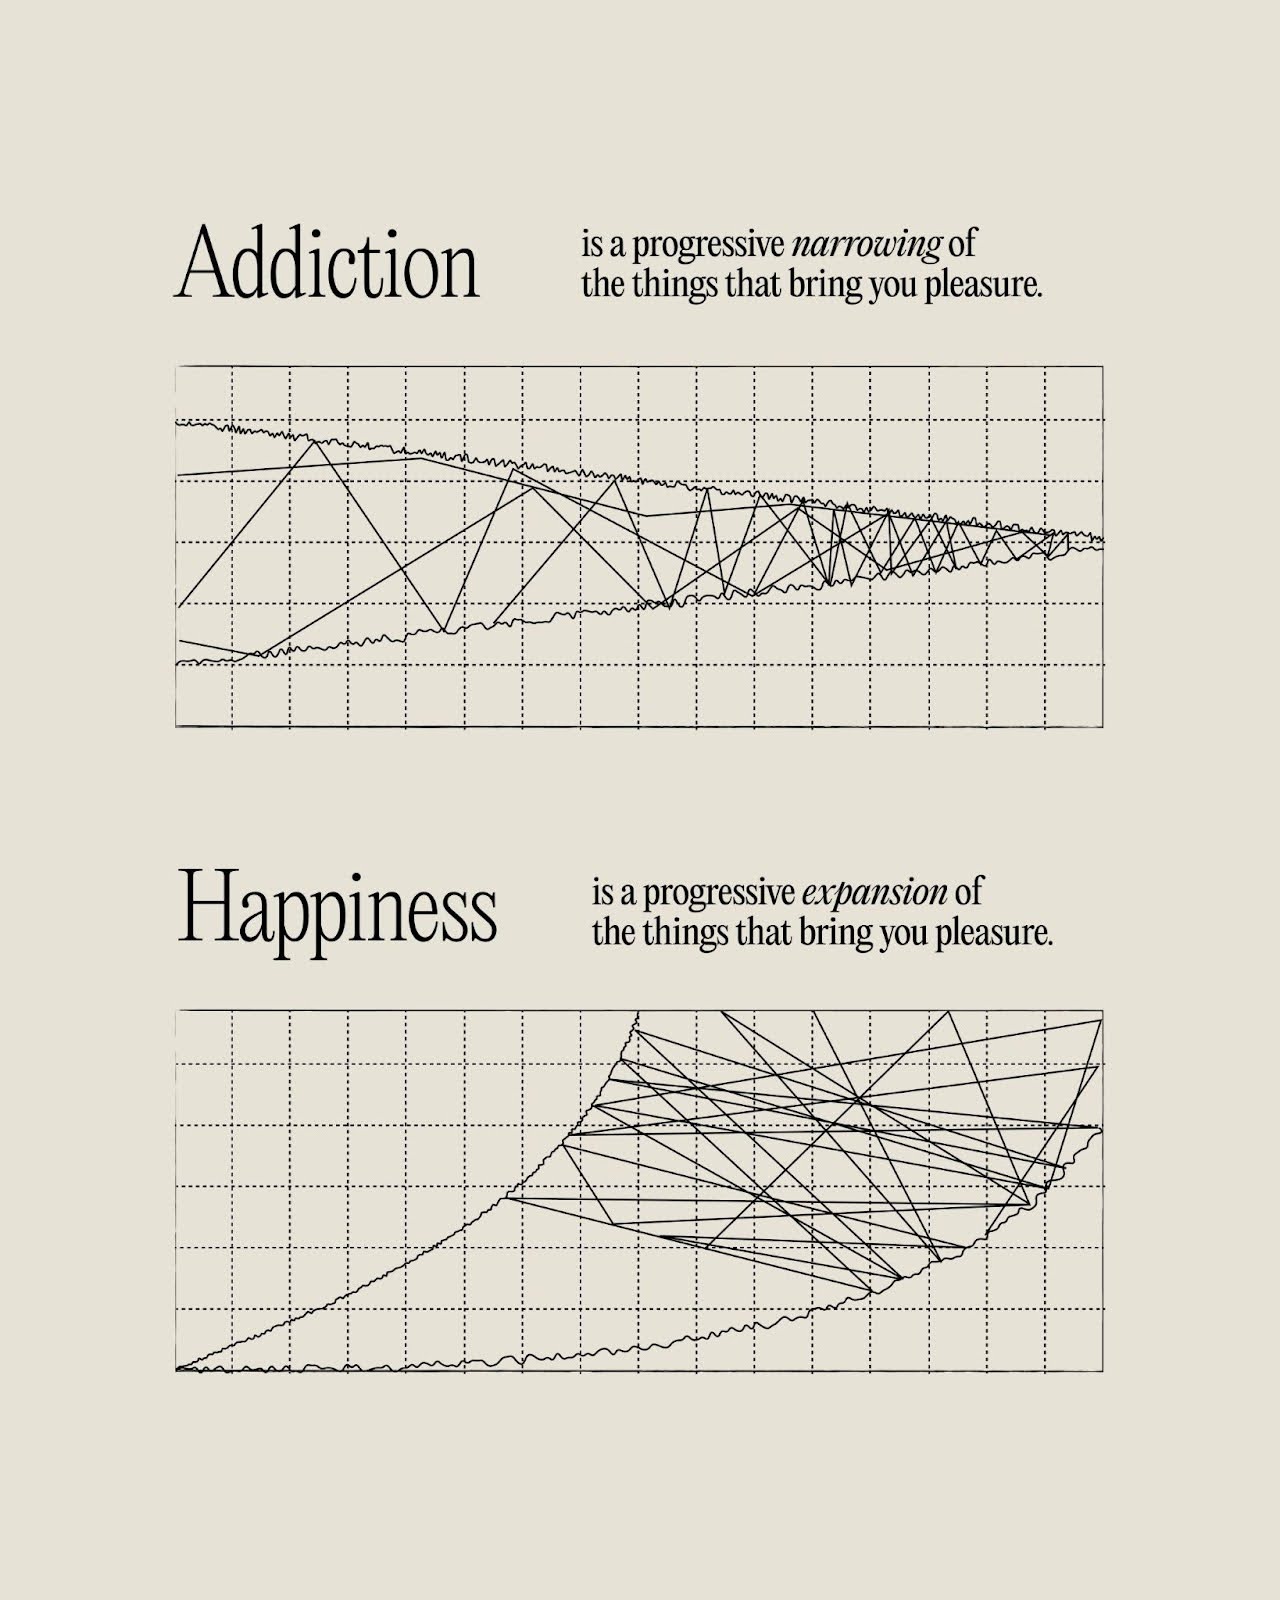
Exploring Contrast: Addiction vs. Happiness in Visual Marketing
This image nails a key marketing principle: contrast sells. Two simple charts — one for “Addiction” and one for “Happiness”...

Harnessing Visual Hierarchy in Infographic Design
This infographic of dogs sprinting across a turquoise background is more than cute—it’s a lesson in movement and hierarchy. The...

Short usage of AI products graph
The image says it all: people go from “wow, this is amazing” to “meh” in a few days. The red...

Harnessing the 80/20 Rule: A Lesson in Simplicity and Impact
This Threads post nails it: a clean list, a credible face, and a universally known rule all packed into one...

Pricing Strategy Success: When Raising Prices Reduces Churn
Tibo from Tweet Hunter pulled a pricing move that broke all the rules. He kept raising his SaaS prices —...

Decoding Probability Perceptions: A Visual Guide for Marketers
This chart shows something wild: when people say “highly likely” or “about even,” they each imagine different odds. The same...

How helpful is your product?
Ever wonder why some products feel “magical” and others are just... fine? This sketch breaks it down perfectly. Every product...

Harnessing the Power of Simplicity and Trust in Influencer Marketing
This Lessie AI landing page nails the perfect mix of trust, clarity, and “try it now” energy. With a pastel...

Visualizing Career Growth: A Swipe-Worthy Example
This graphic nails how to make dry stats instantly engaging: a 3D bar chart showing the “Fastest-growing careers in the...

Eye-Catching Popups: Harnessing the Power of Bold Visuals
This landing page from Alia is a masterclass in grabbing attention fast. It promises innovation, shows proof, and directs visitors...

Decoding Entertainment Occupations: Marketing Insights from Structured Visuals
This chart makes it crystal clear: entertainers aren’t just clowns and singers anymore. “Digital Content Creators” now sit alongside DJs...
Unlocking Value: The 5x Rule for Hiring
Ayman Al-Abdullah dropped a simple but killer hiring rule: only hire people who can produce 5x the value of their...
Decoding Financial Goals: A Lesson in Clarity from Jason Cohen
Jason Cohen flips the usual “hit $1M ARR” goal on its head. He asks: what’s the difference between that and...

Striking Visuals and Copy: Analyzing the Motorcycle Safety Infographic
This chart nails fear-based messaging with cold, clean data. The headline “Motorcycles are the deadliest” grabs your gut, then the...

Visualizing the Future: Analyzing a Strategic Master Plan Image
This visual from Tesla turns a complex, multi-year plan into a clear story anyone can grasp in seconds. No buzzwords,...
From $100,000 to $2B, the differences in mentalities
Sam Parr tweeted about wealth levels and noted an interesting point: people start to feel rich once they hit $50k–$100k...