1,913 Images and Illustration Examples That Teach Things
Drawings and illustrations and photography can transmit more information from human-to-human than text can. This board is perfect for designers and marketers seeking visual inspiration.

R180 Smart Cooker Toaster Print Ad
This R180 Smart Toaster ad turned breakfast into a design palette. Each shade of toast is displayed like paint swatches—from...

1976 Parker Pen Mechanical Pencil Ad
This Parker ad doesn’t need fancy persuasion. It just shows a bent “super-long” pencil next to the mechanical one and...
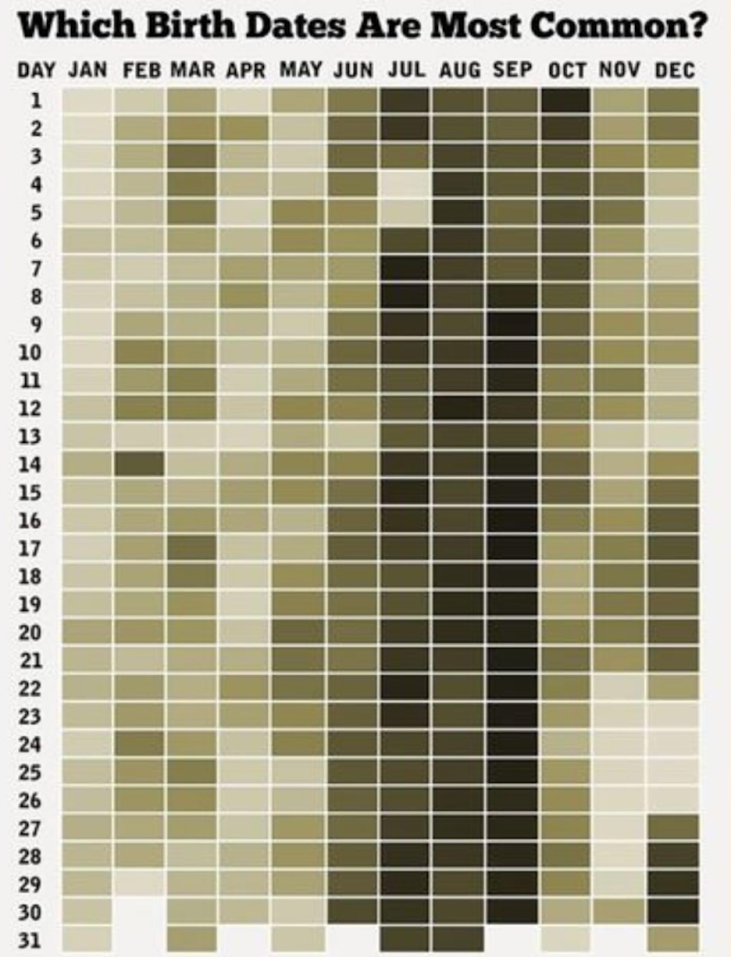
Common birth dates easy-to-read chart
Ever looked at a data chart and thought, “ah, now THAT makes sense”? This birthday heatmap nails it. Just a...

Financial images and charts
This “Reasons to Sell” chart is a masterclass in data storytelling. In one image, it tells a 15-year story of...

Most regretted college majors chart
This chart hits hard: up to 87% of journalism grads regret their major. Why? They put in the work, paid...

Cool graphic categorizing all the ways to make freelance money
This infographic nails attention design. It maps 150 gigs for earning money and shows eye-tracking heatmaps revealing exactly where viewers...
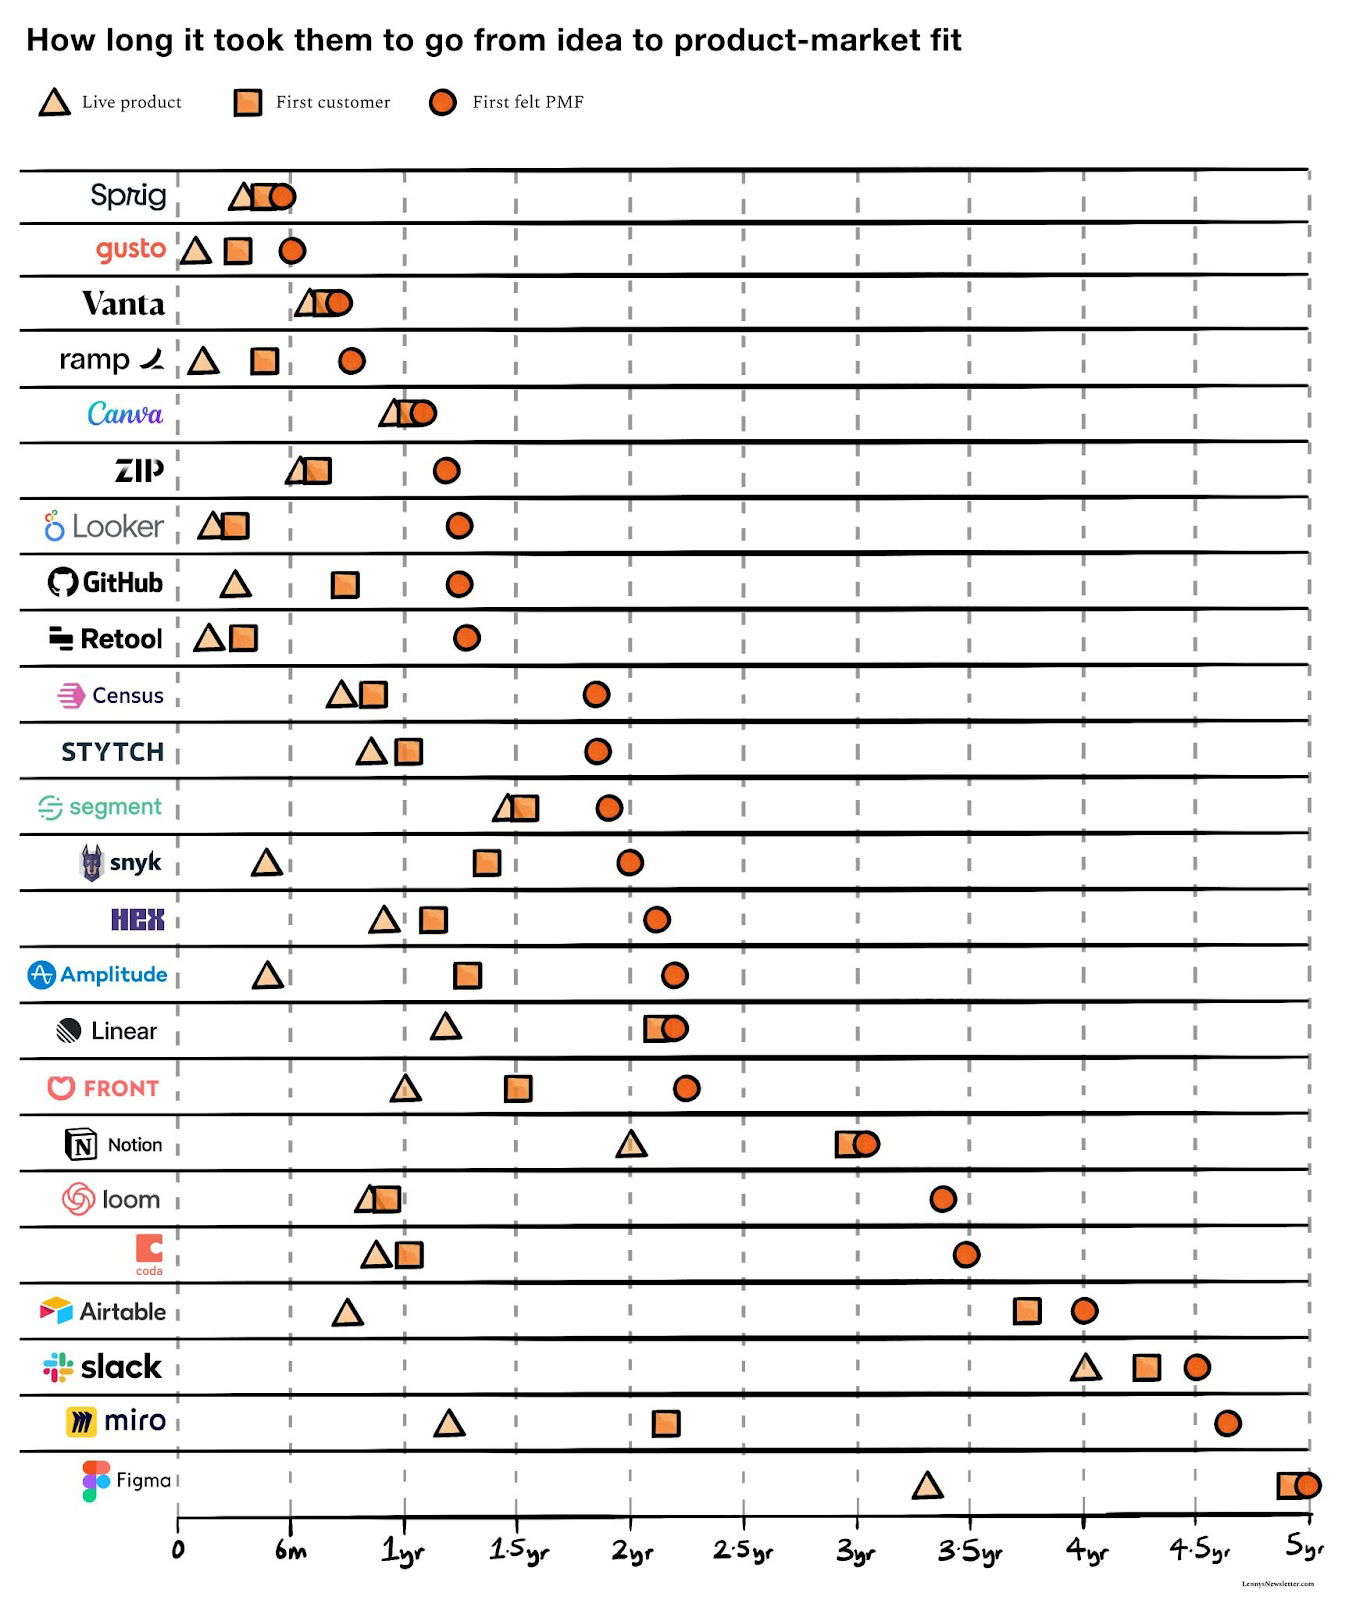
Cool graph shows time to launch a product, get a customer, and product market fit
Here’s a wild one: a chart showing how long it took top startups to launch, get their first customer, and...
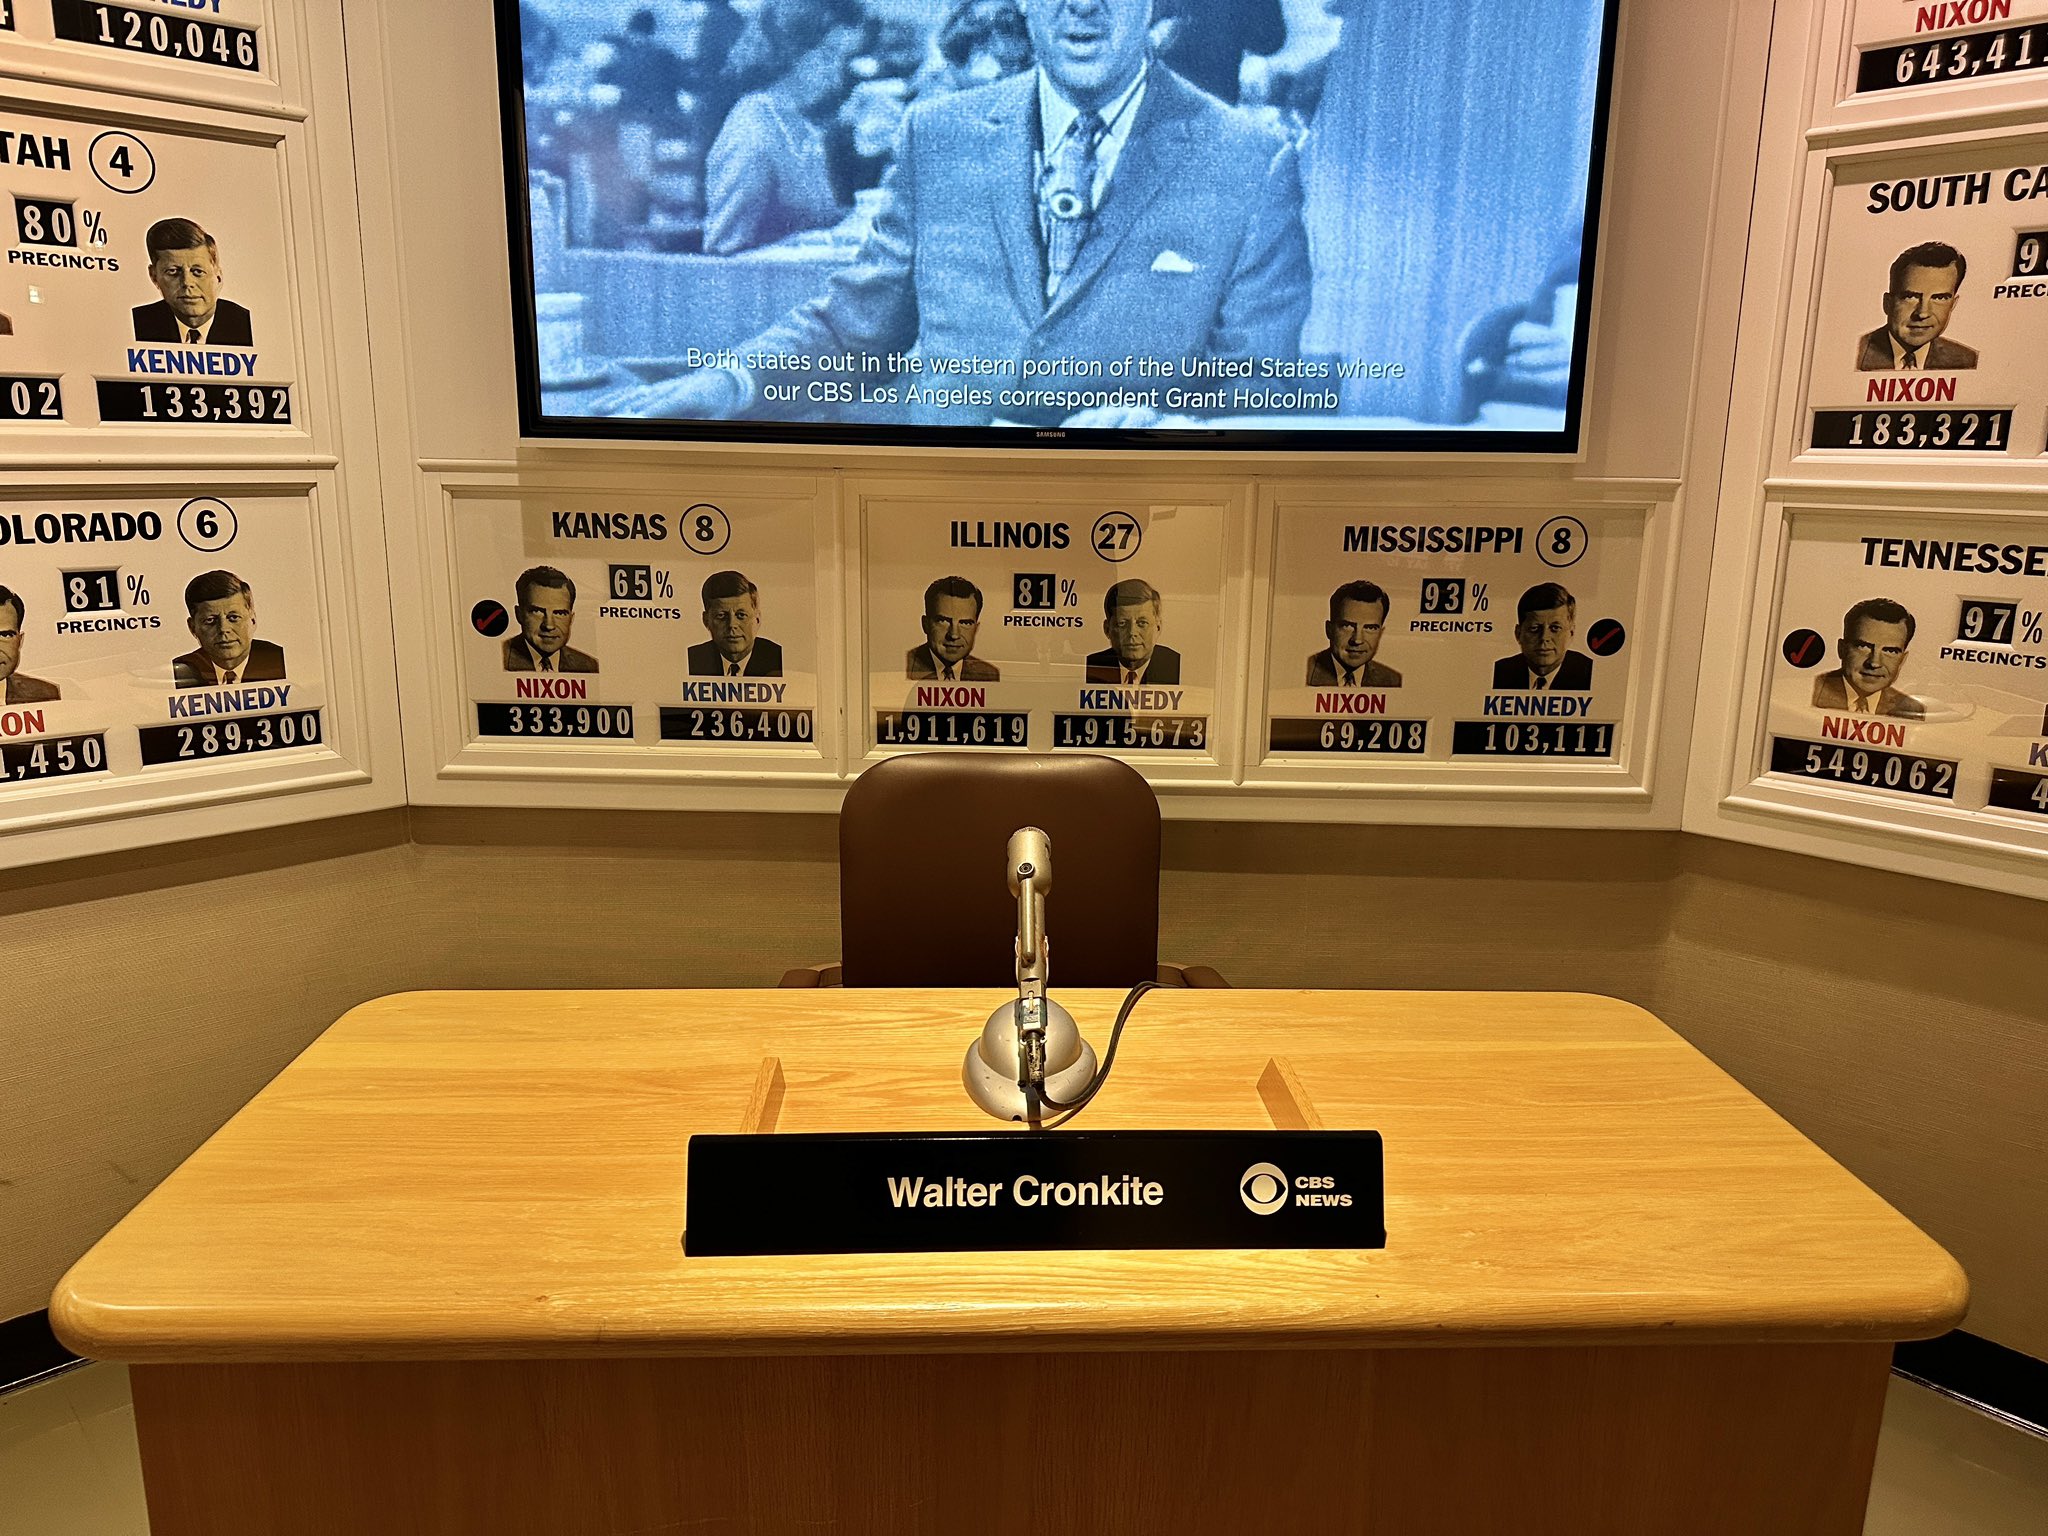
1970's CBC News Election Broadcast Setup
In the 1970s, only a few elite news anchors like Walter Cronkite could broadcast to millions. They needed million-dollar studios...

MarketingProfs Event Sales Page
The heatmap says it all: people don’t stare at words, they stare at faces. On the “AI for Content Creators”...
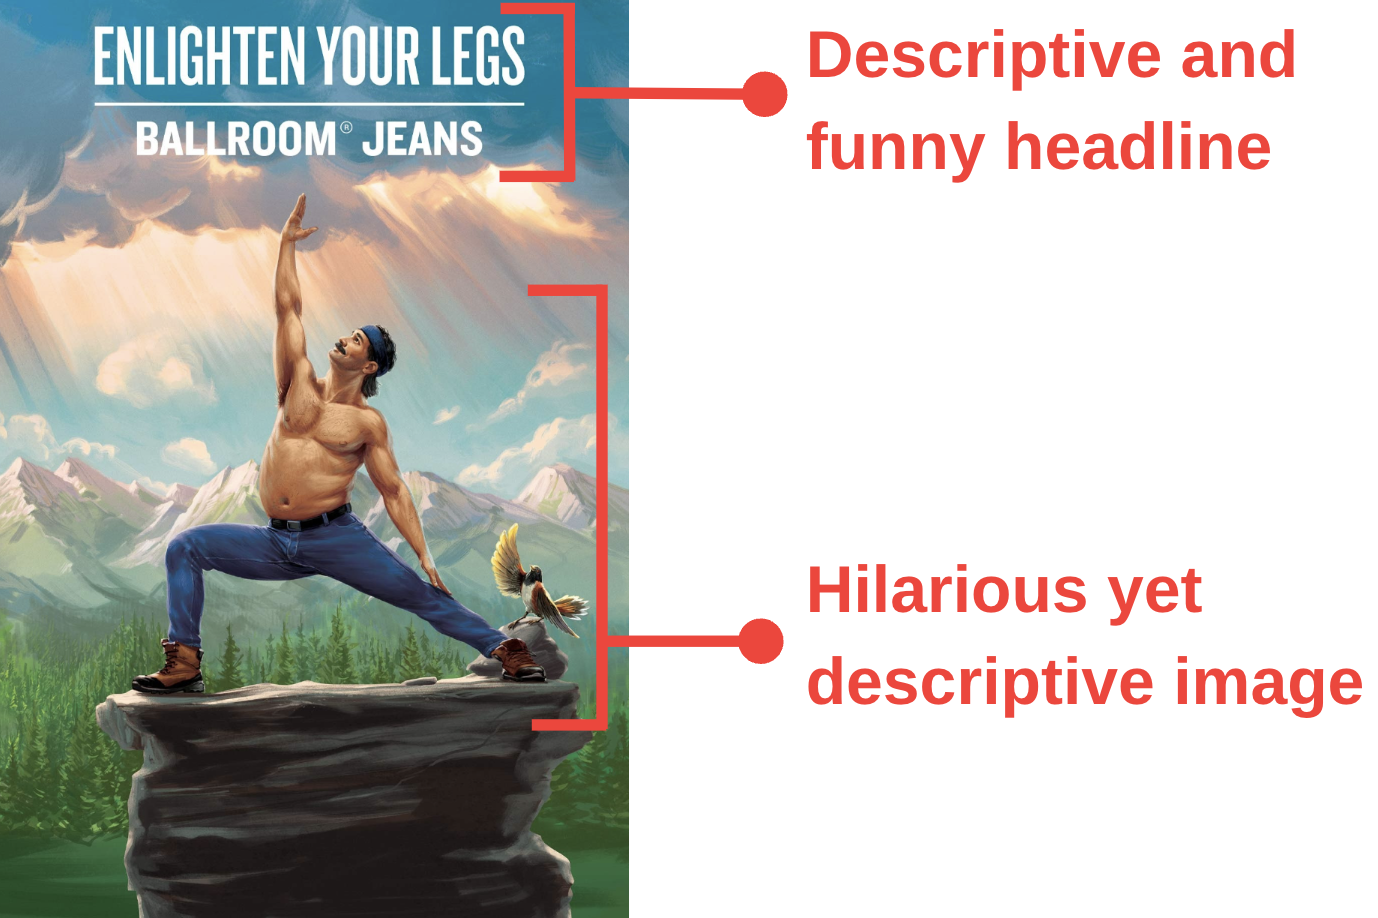
Duluth Trading Company Funny Jeans Ad
Duluth Trading Company nailed it with this email header for their Ballroom Jeans. The image looks like a cross between...
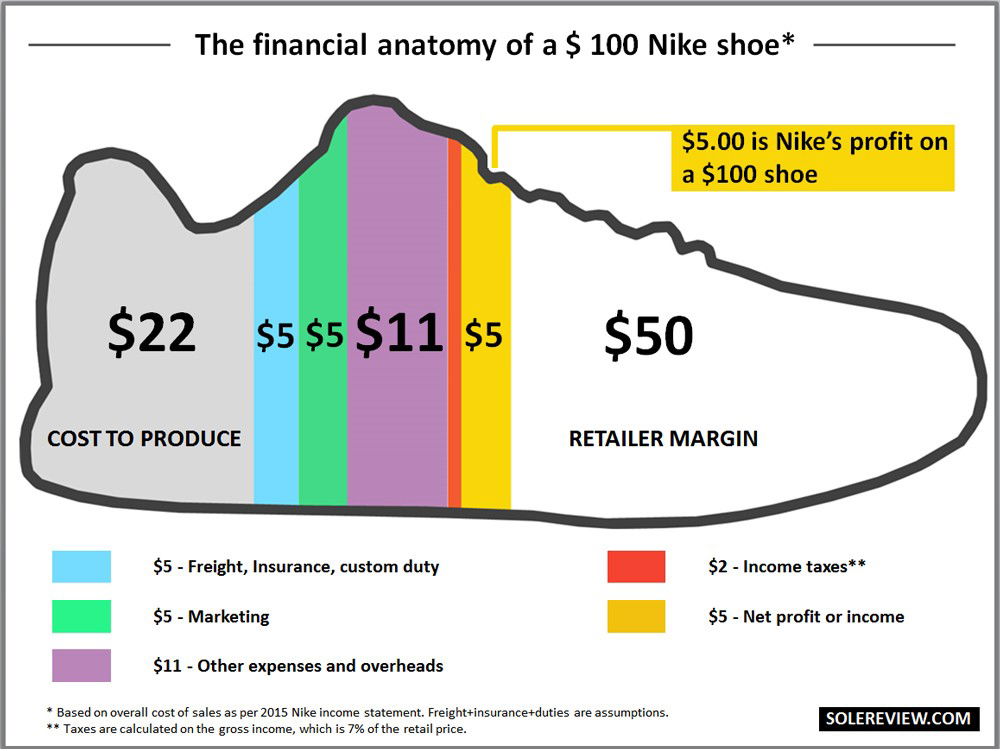
Shoe profits bar chart
This eye-tracking study on Nike’s $100 shoe profit chart reveals a juicy secret: people don’t read graphics the way we...

Consolidation of the soft drinks industry
That chart is wild. Coca-Cola, PepsiCo, and Keurig Dr Pepper control nearly 94% of the soft drink market. Every “different”...
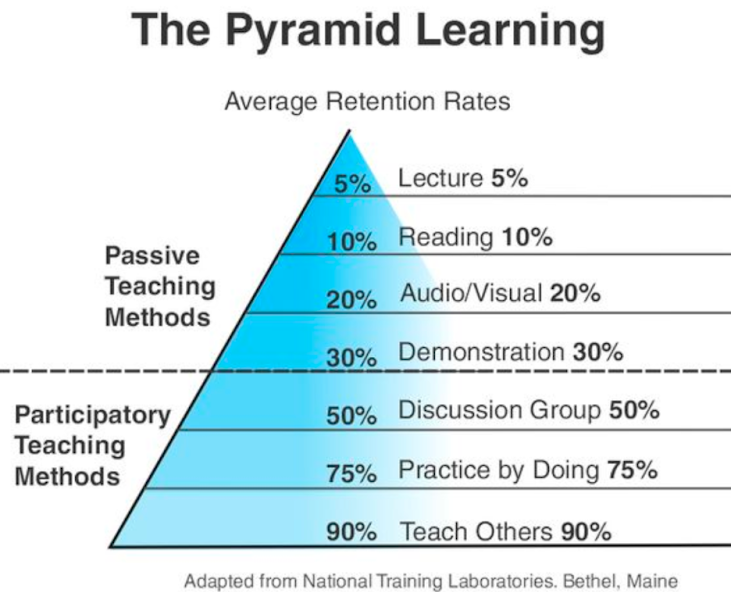
“Learning Pyramid” chart
This chart is a goldmine for marketers. It shows how much people actually remember from different learning methods. Spoiler: lectures...
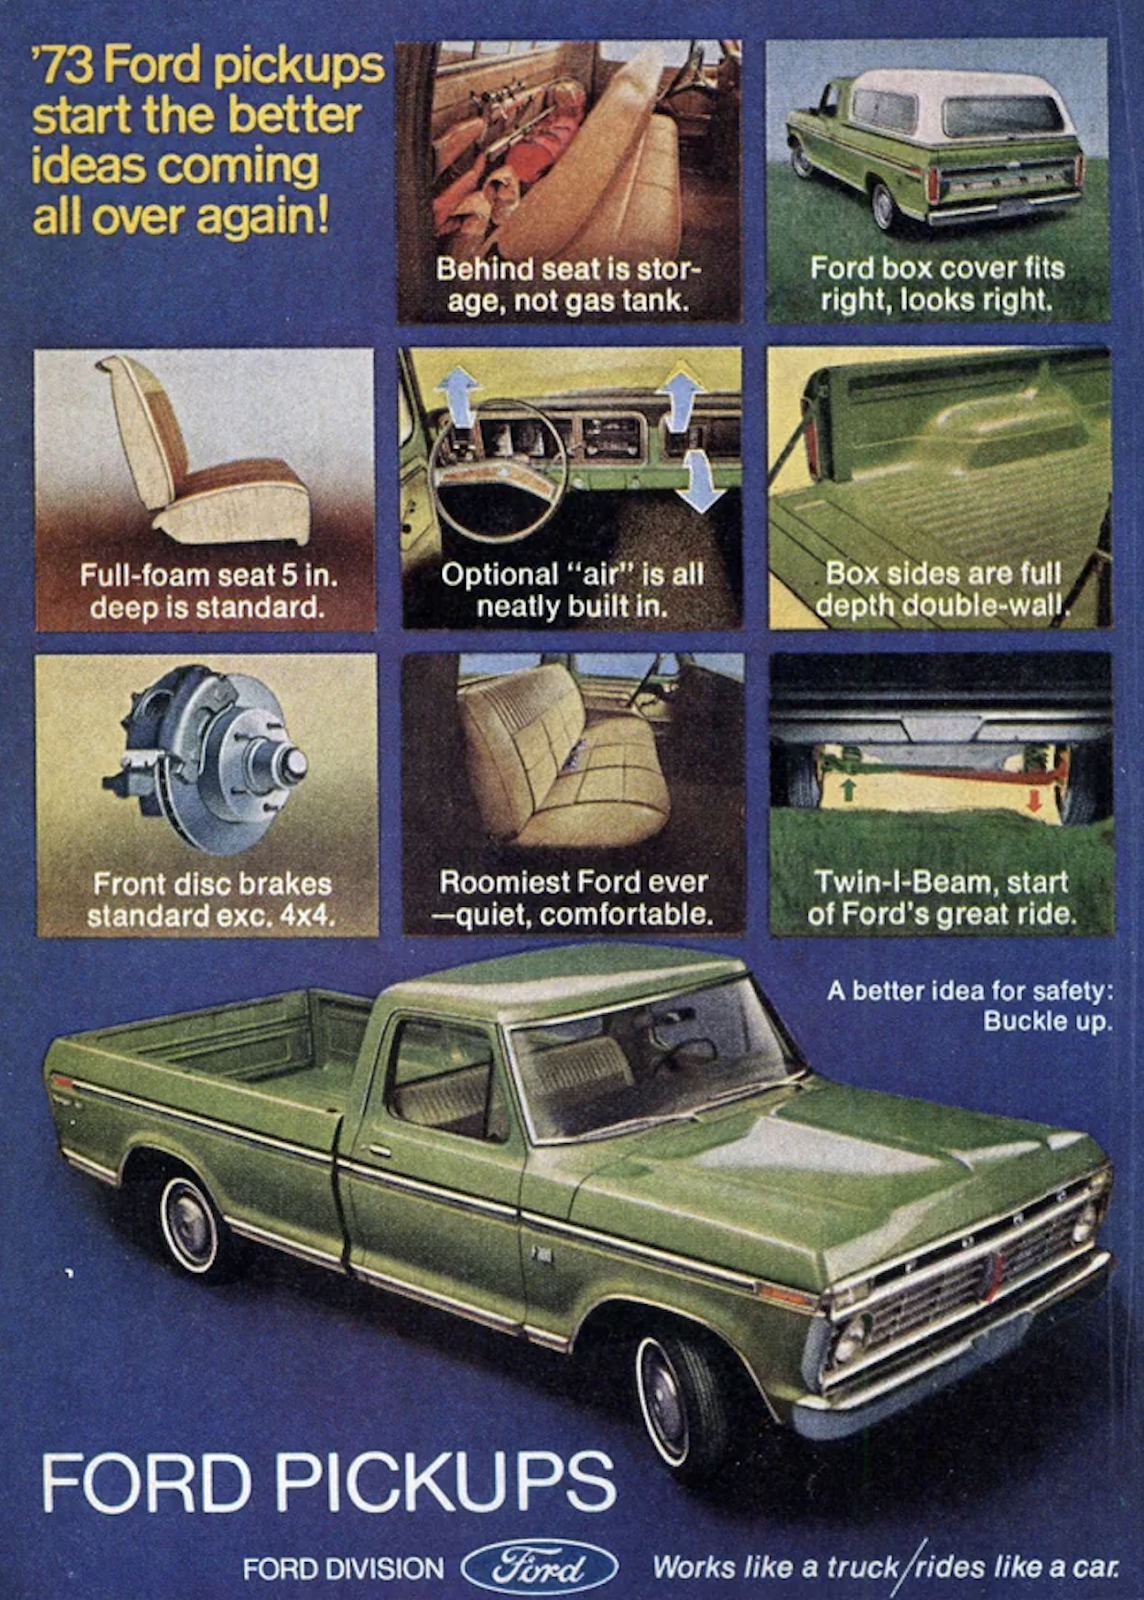
1973 Ford Pickup Print Ad
This vintage Ford pickup ad isn’t just pretty — it’s a masterclass in clarity. Each box highlights a truck feature...
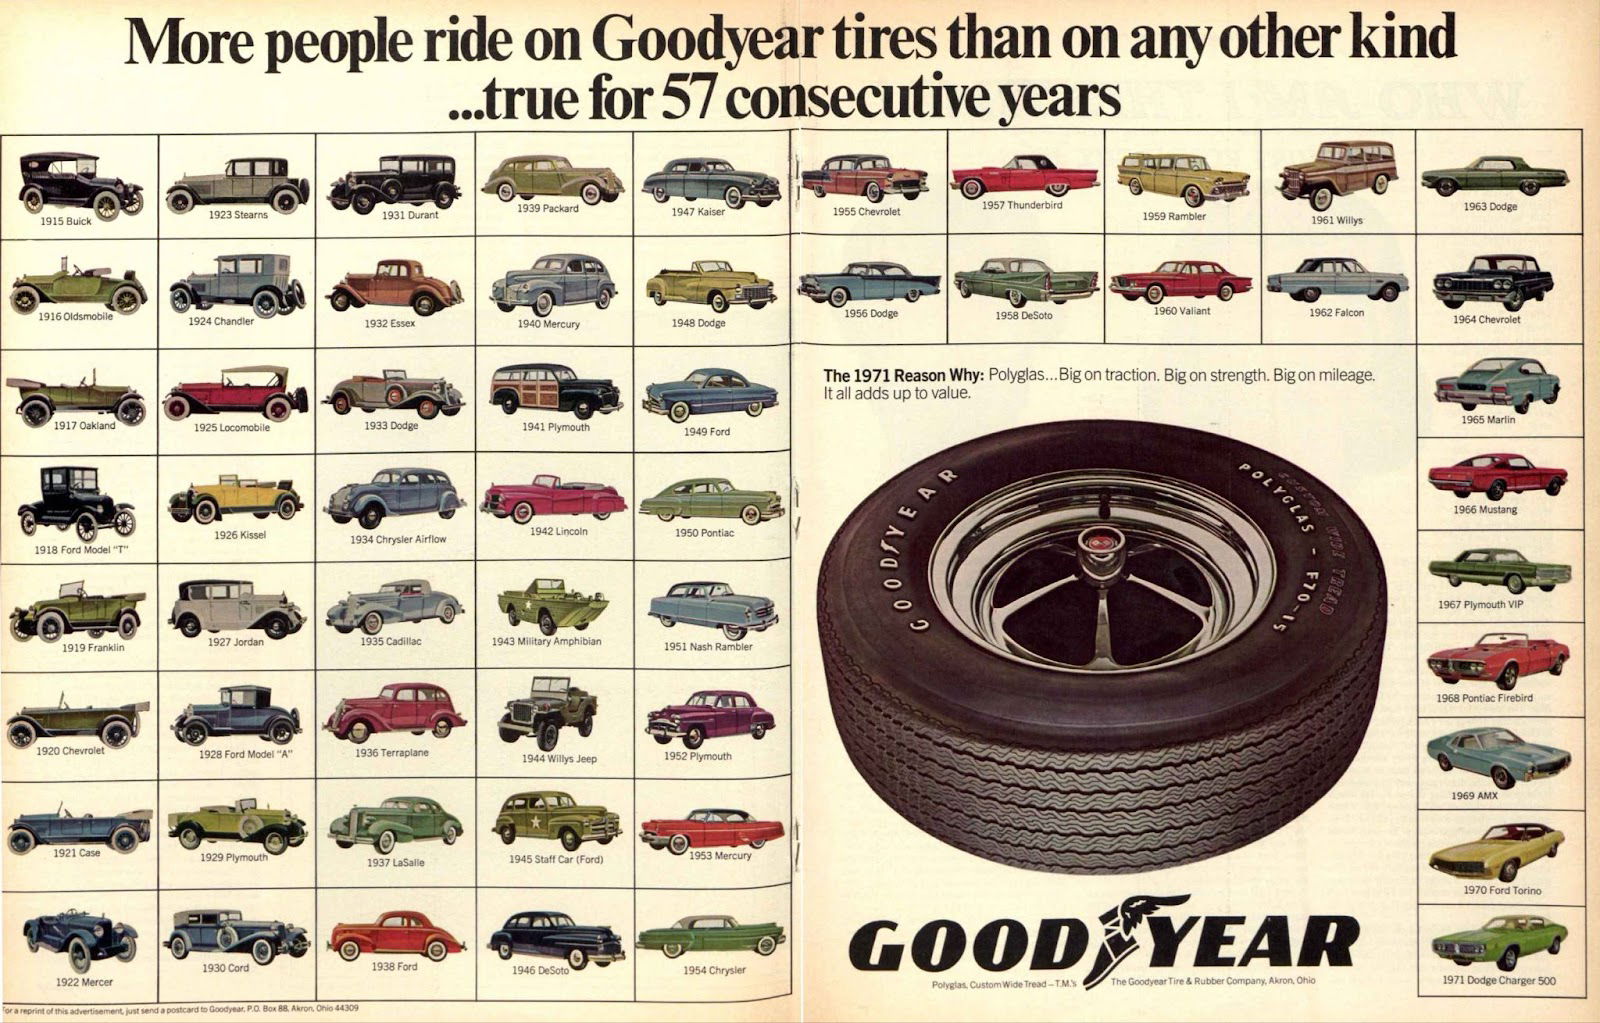
Cool “social proof” style Good Year ad
This ad is a masterclass in visual persuasion. It proves two things: people trust what others already trust, and your...
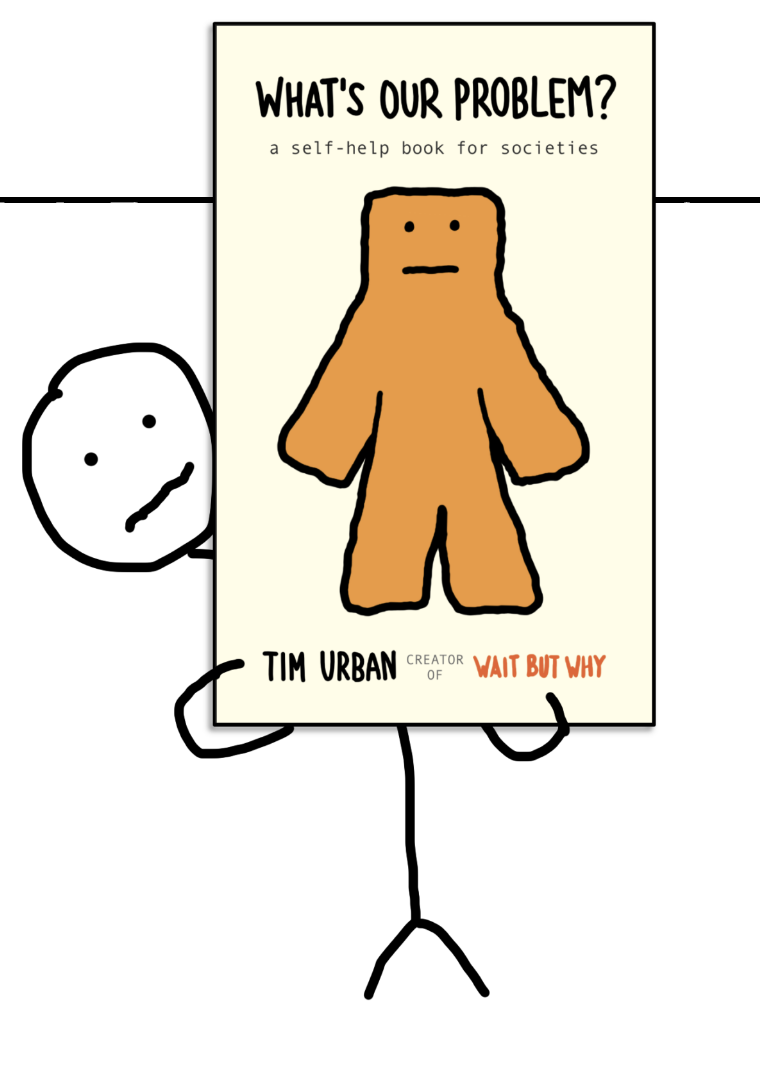
Awesome book promo stick figure
This promo for Tim Urban’s What’s Our Problem? is a masterclass in visual focus. It’s minimal, funny, and instantly recognizable...

Using bad testimonials to show the good
Most brands panic when they get bad reviews. Snowbird Ski Resort? They printed theirs on a billboard. The ad features...
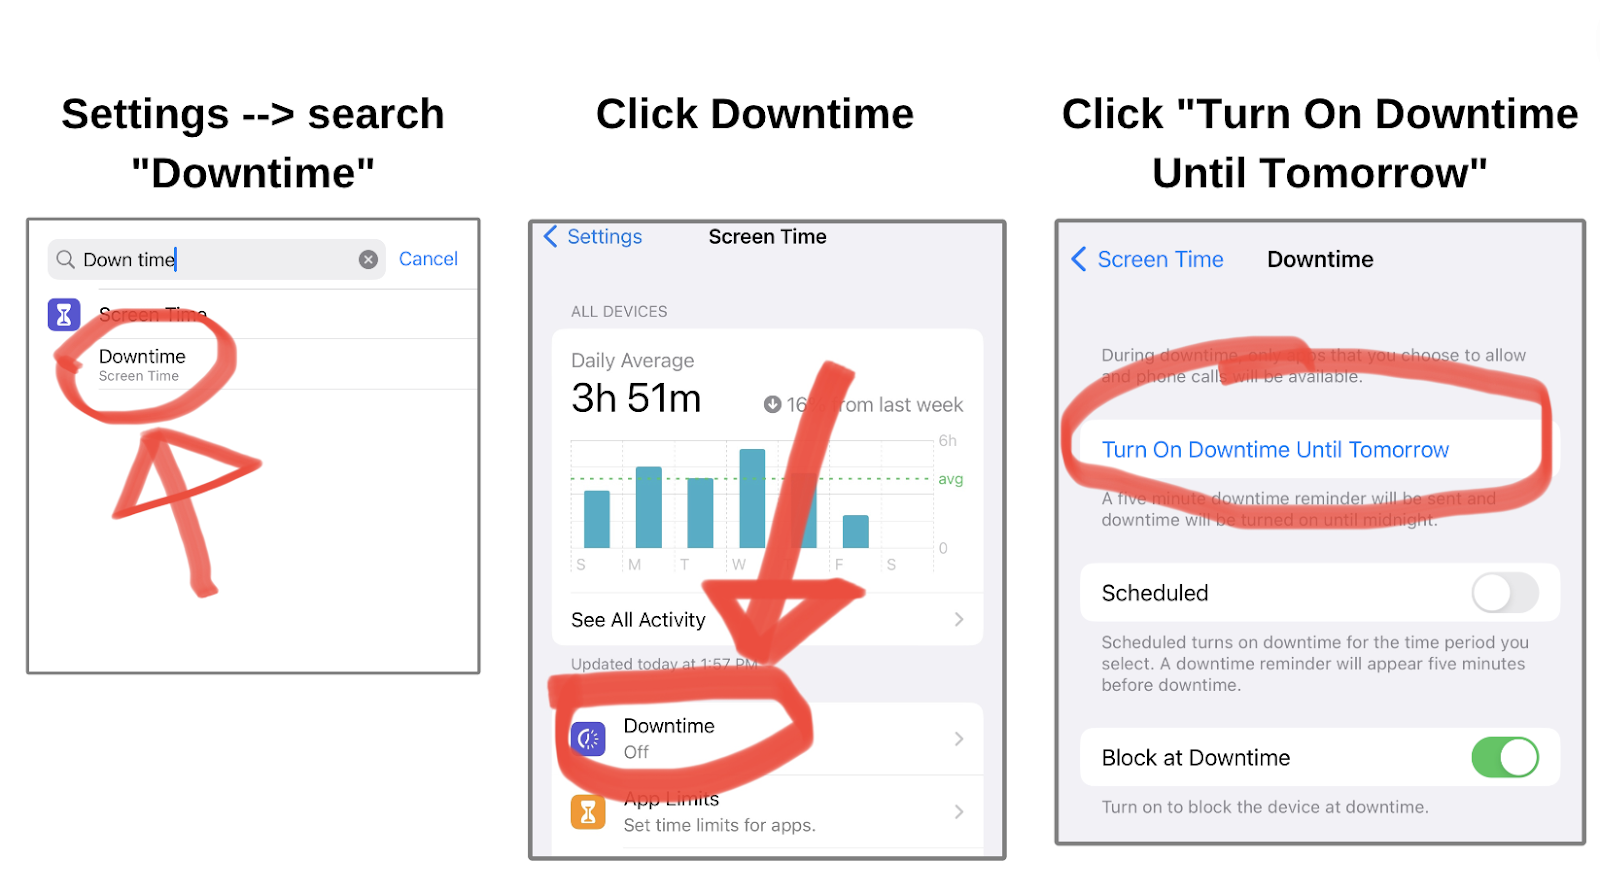
Have a better weekend with less screen time
Everyone talks about cutting screen time, but this post shows exactly how to do it in 3 easy clicks. The...

Clever Coffee Graphic Off/On
A cup of coffee becomes an ON switch. Simple, visual, and brilliant. The image plays with words and design—no copy...

What you planned -vs- What really Happened
Ever start your day with a perfect plan… and by noon, you’re juggling Slack, emails, and random “urgent” stuff? The...
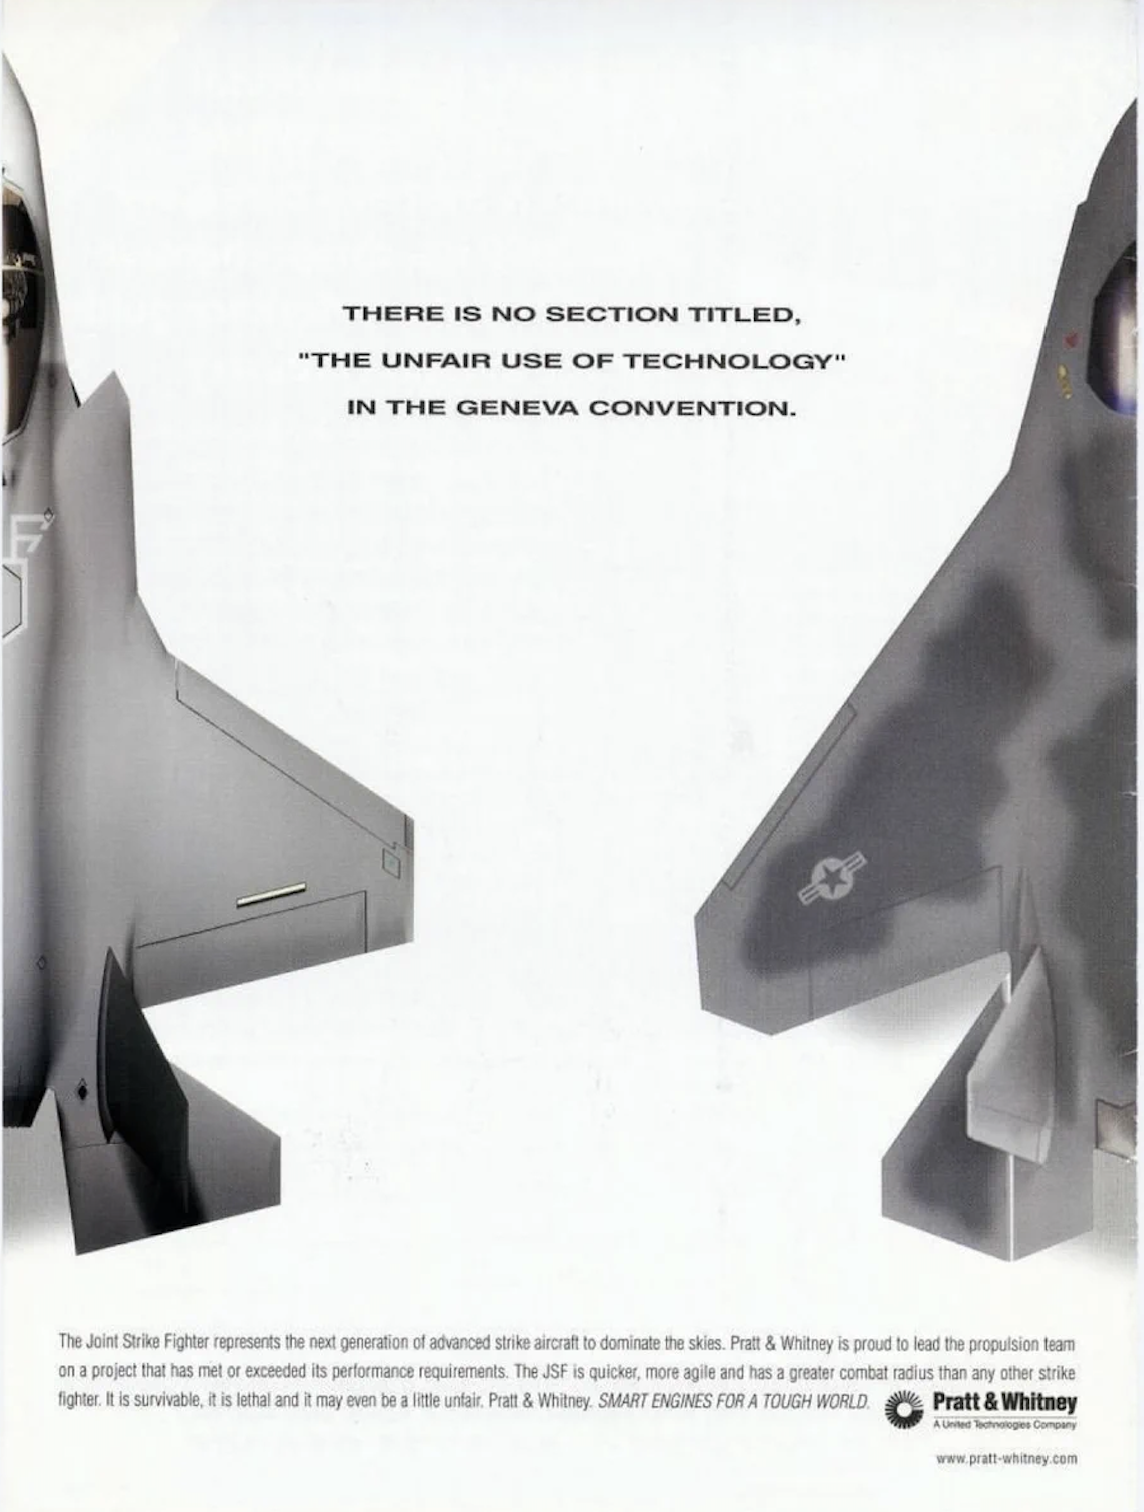
Pratt & Whitney defense contract print ad
The F-35 project was under fire for its ballooning budget. So how do you spin that? You make “too advanced”...

Snickers Iced Coffee Can
You can almost hear the brainstorming: “What if we mixed the top two things people buy at gas stations? Candy...
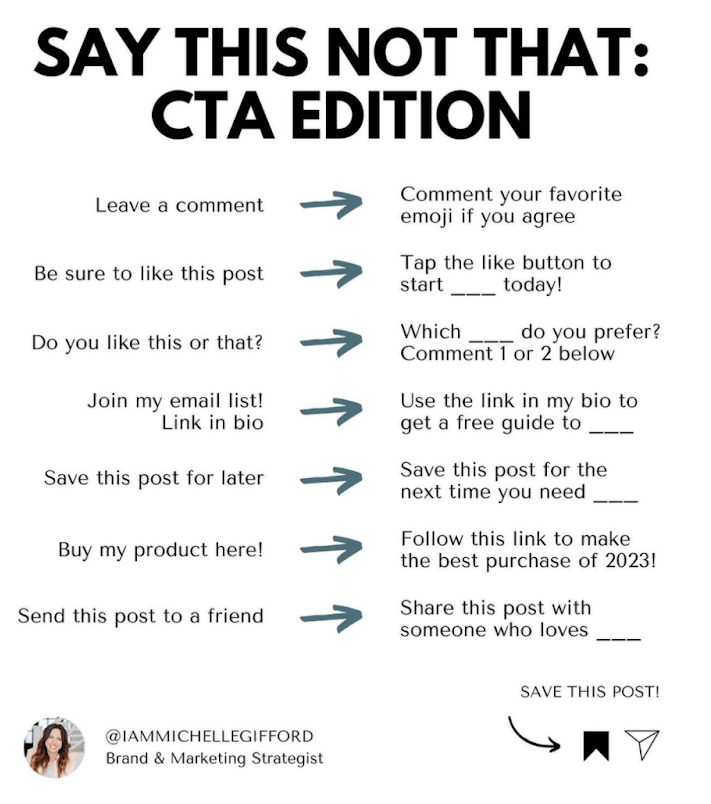
Different Call To Action Examples:
Most CTAs sound like dull instructions: “Click here,” “Join now,” “Save this post.” Snooze. This graphic shows how to make...
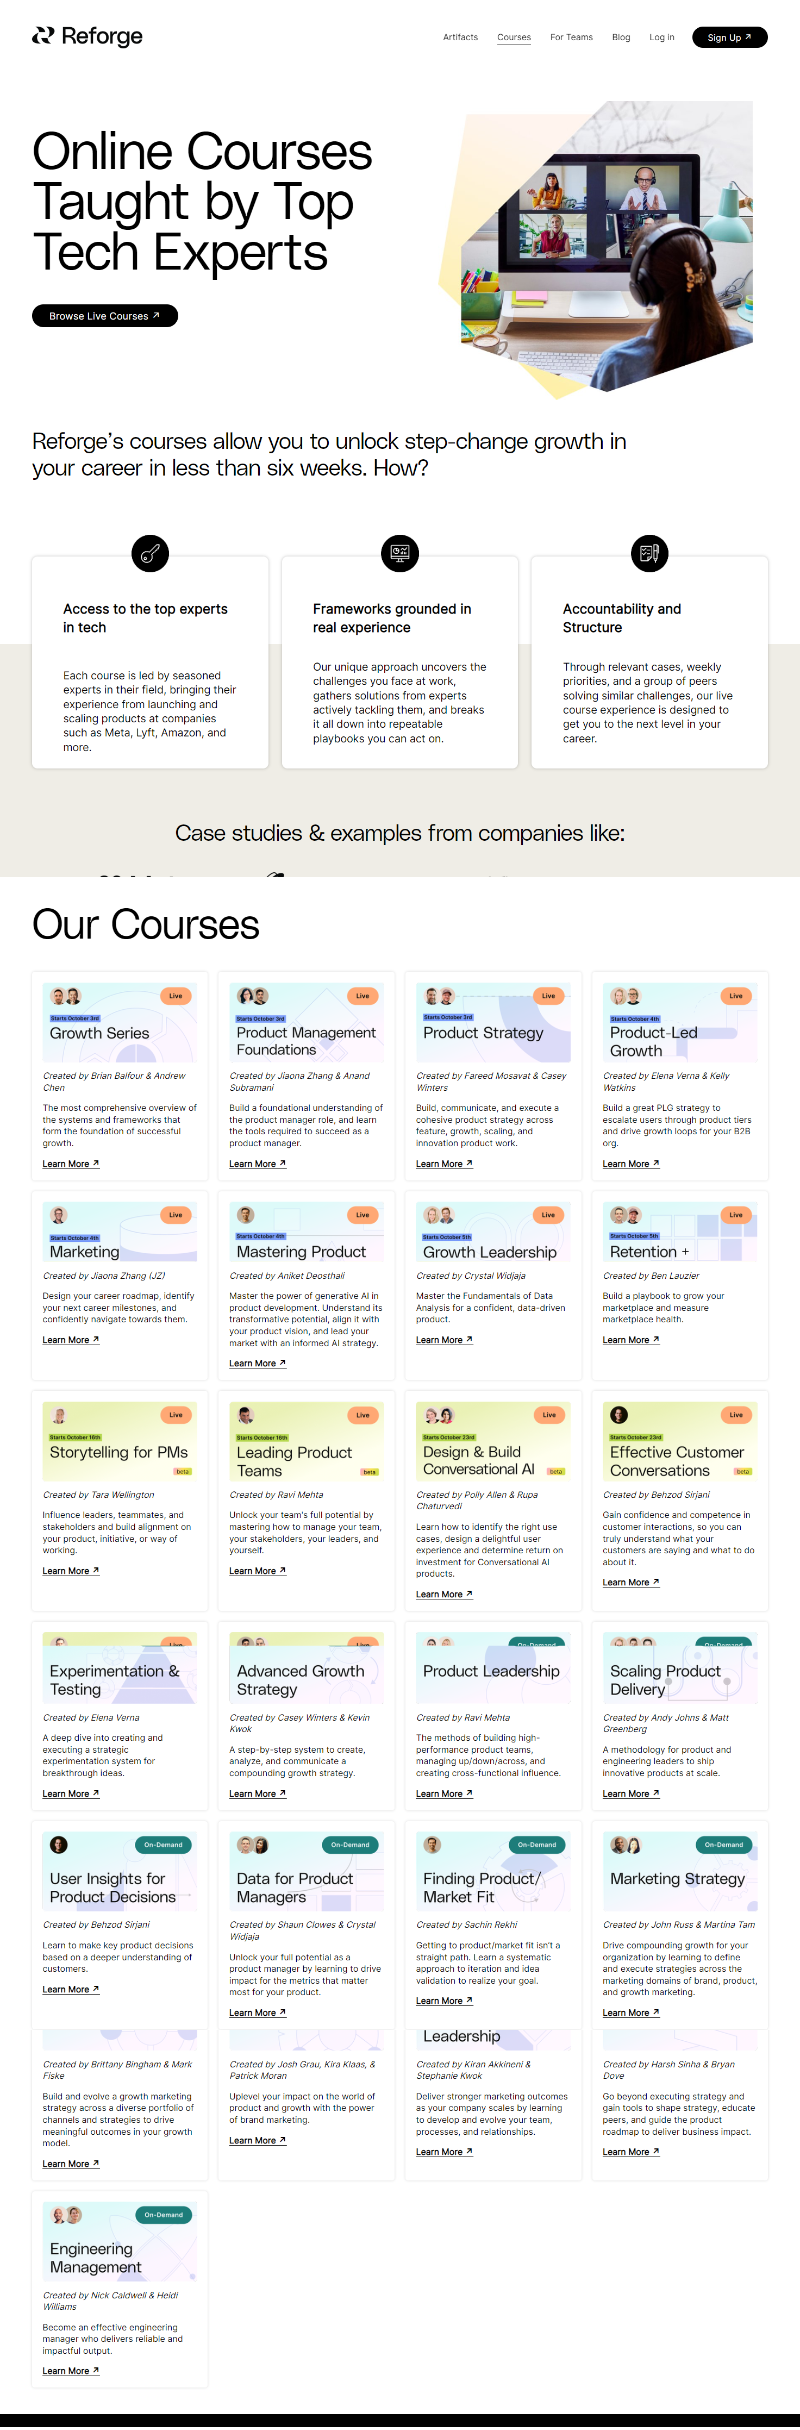
Reforge courses landing page:
Reforge’s course page doesn’t scream “Buy now.” It quietly proves its value. From expert names to clean design, everything builds...