1,913 Images and Illustration Examples That Teach Things
Drawings and illustrations and photography can transmit more information from human-to-human than text can. This board is perfect for designers and marketers seeking visual inspiration.
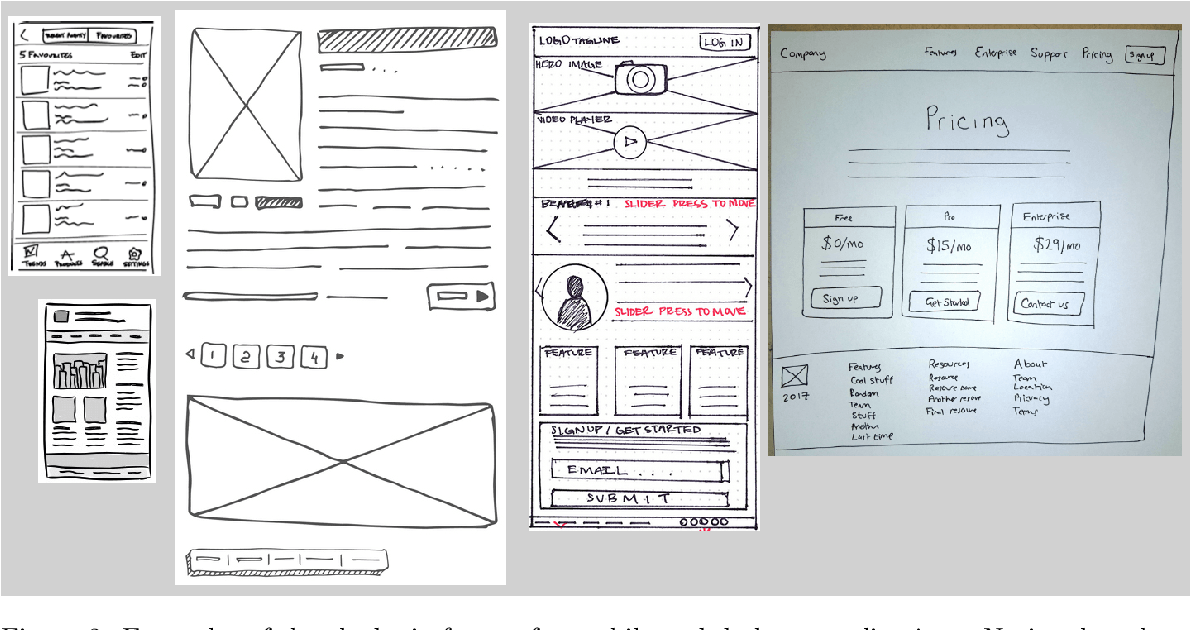
Planning out UI/UX with pen & paper
Designers love Figma, but sometimes the fastest way to fix a messy user flow is by grabbing a pen. These...
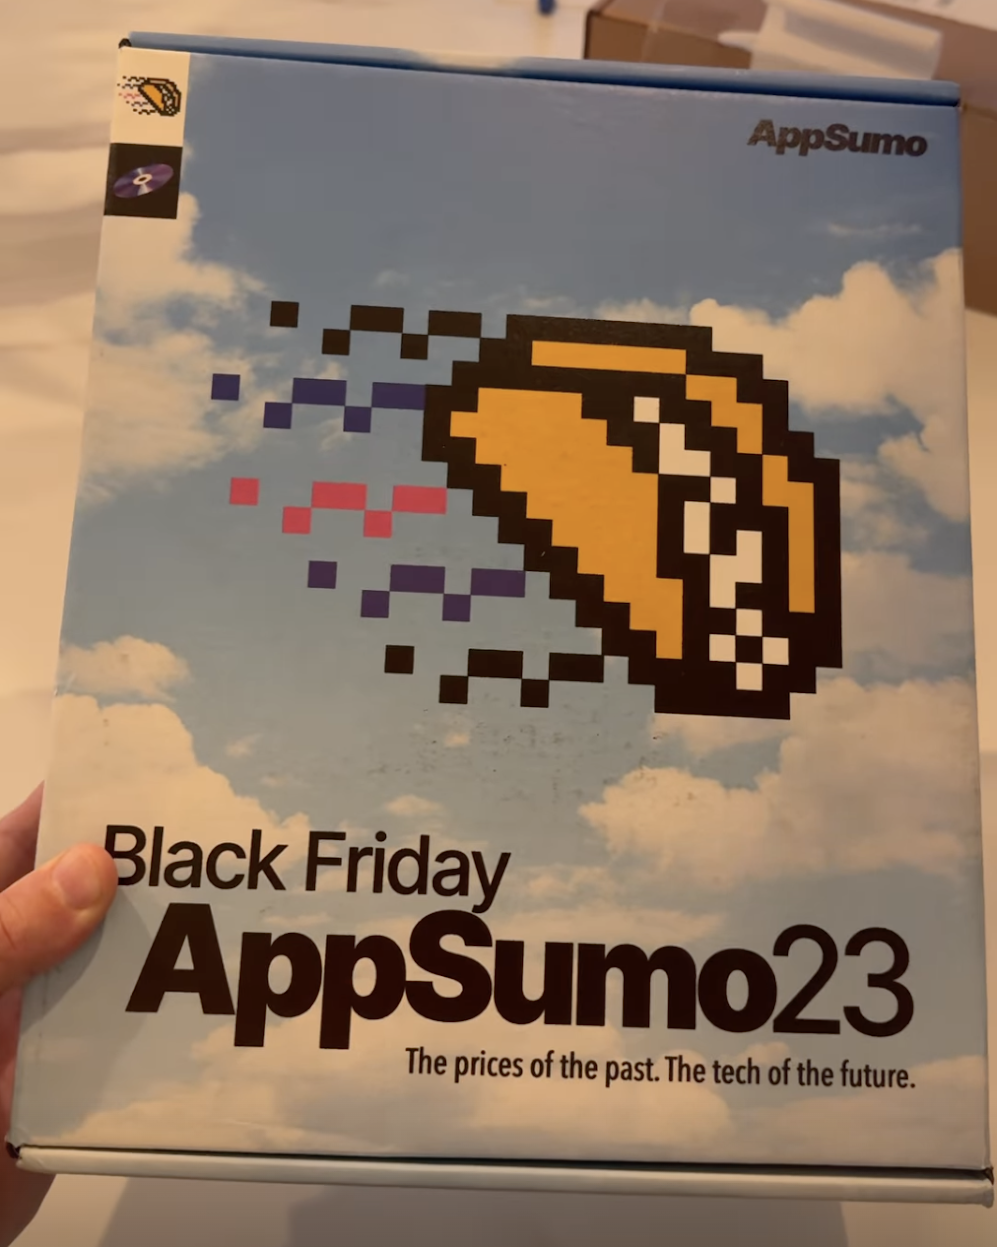
AppSumo Black Friday Retro-Advertising
AppSumo nailed this one. Their Black Friday promo mimics the classic Windows 95 box, but swaps the logo for an...
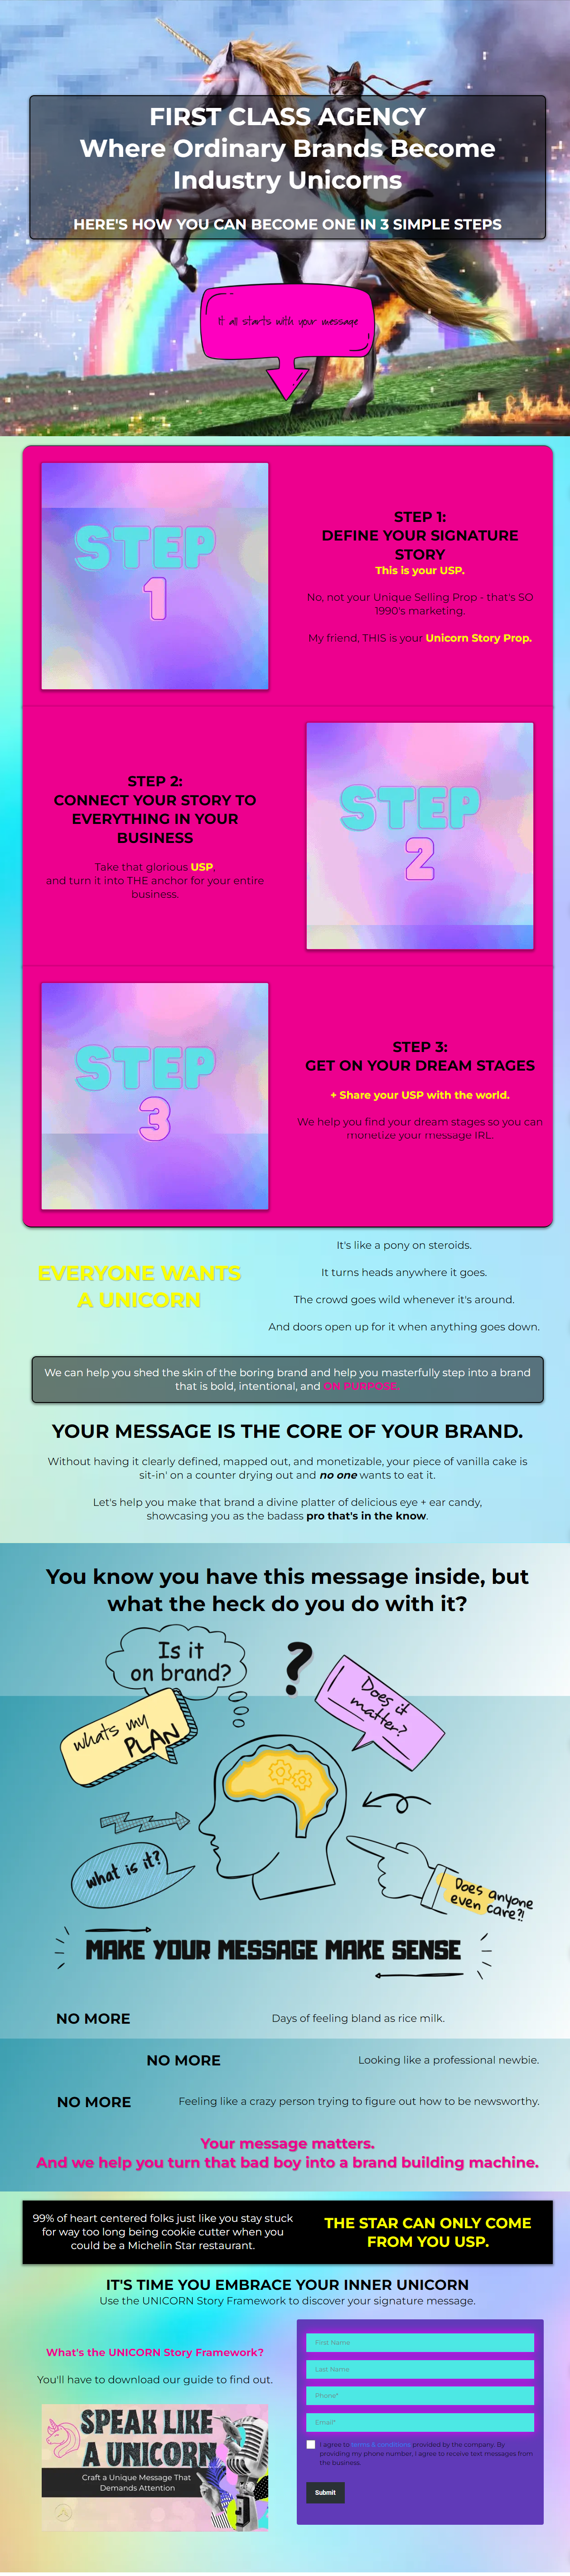
Hilarious and unique marketing agency landing page
This homepage from First Class Agency is a masterclass in grabbing attention. Bright colors, bold fonts, a unicorn with a...
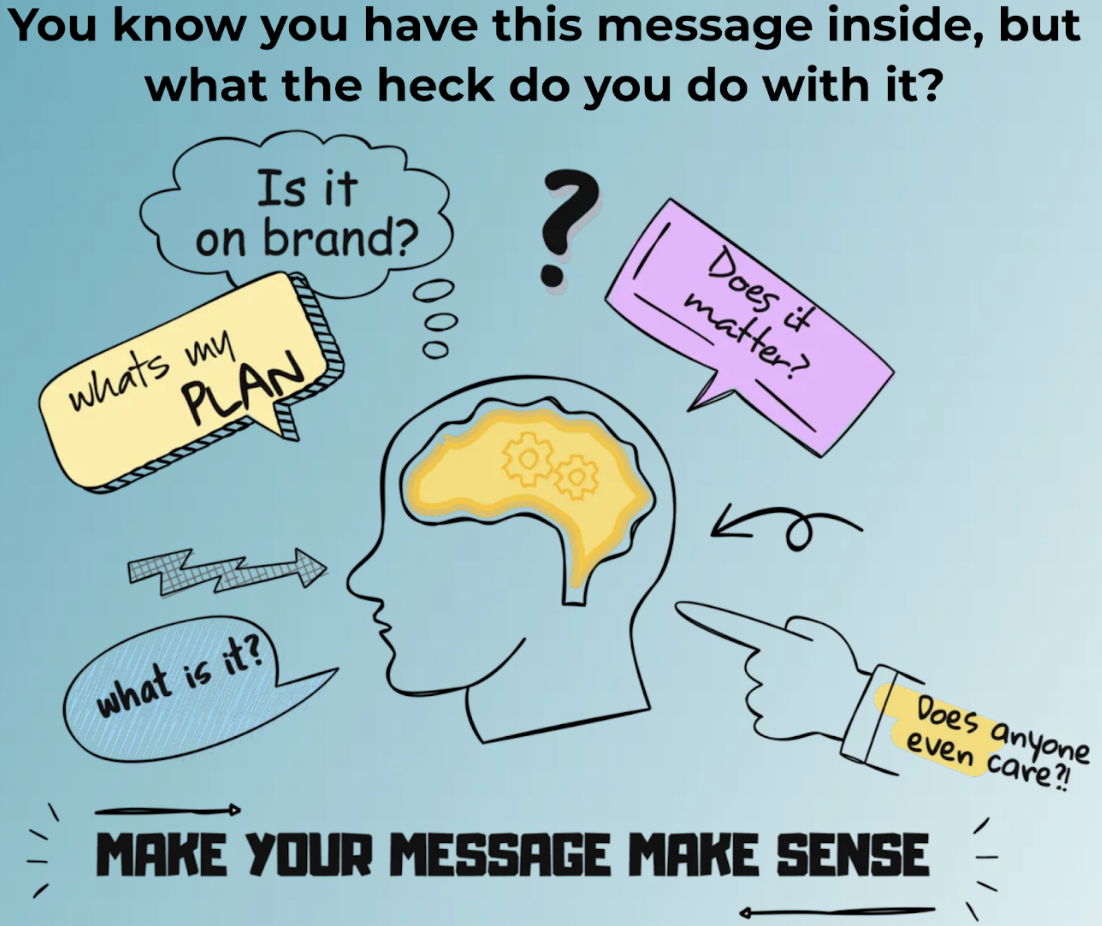
Awesome agency messaging graphic
Ever see a visual that instantly clicks? This one nails it. A simple head graphic asking every question your brain...

Change the paint, change the room
This paint chart is marketing 101 in disguise. Just by shifting where the color goes, the whole room feels different....

AirBnB revenue went up after painting house black
A guy in Oregon painted his gray Airbnb cabin black — and his revenue jumped. Same house, same forest, just...

The Pareto Principle in action
This chart nails the 80/20 rule in consumer goods. It shows which products are used evenly across the population and...

Speak French, Visit France. Speak English, Visit the World.
This billboard nails its message in two short sentences. It says: “Speak French, Visit France. Speak English, Visit the World.”...
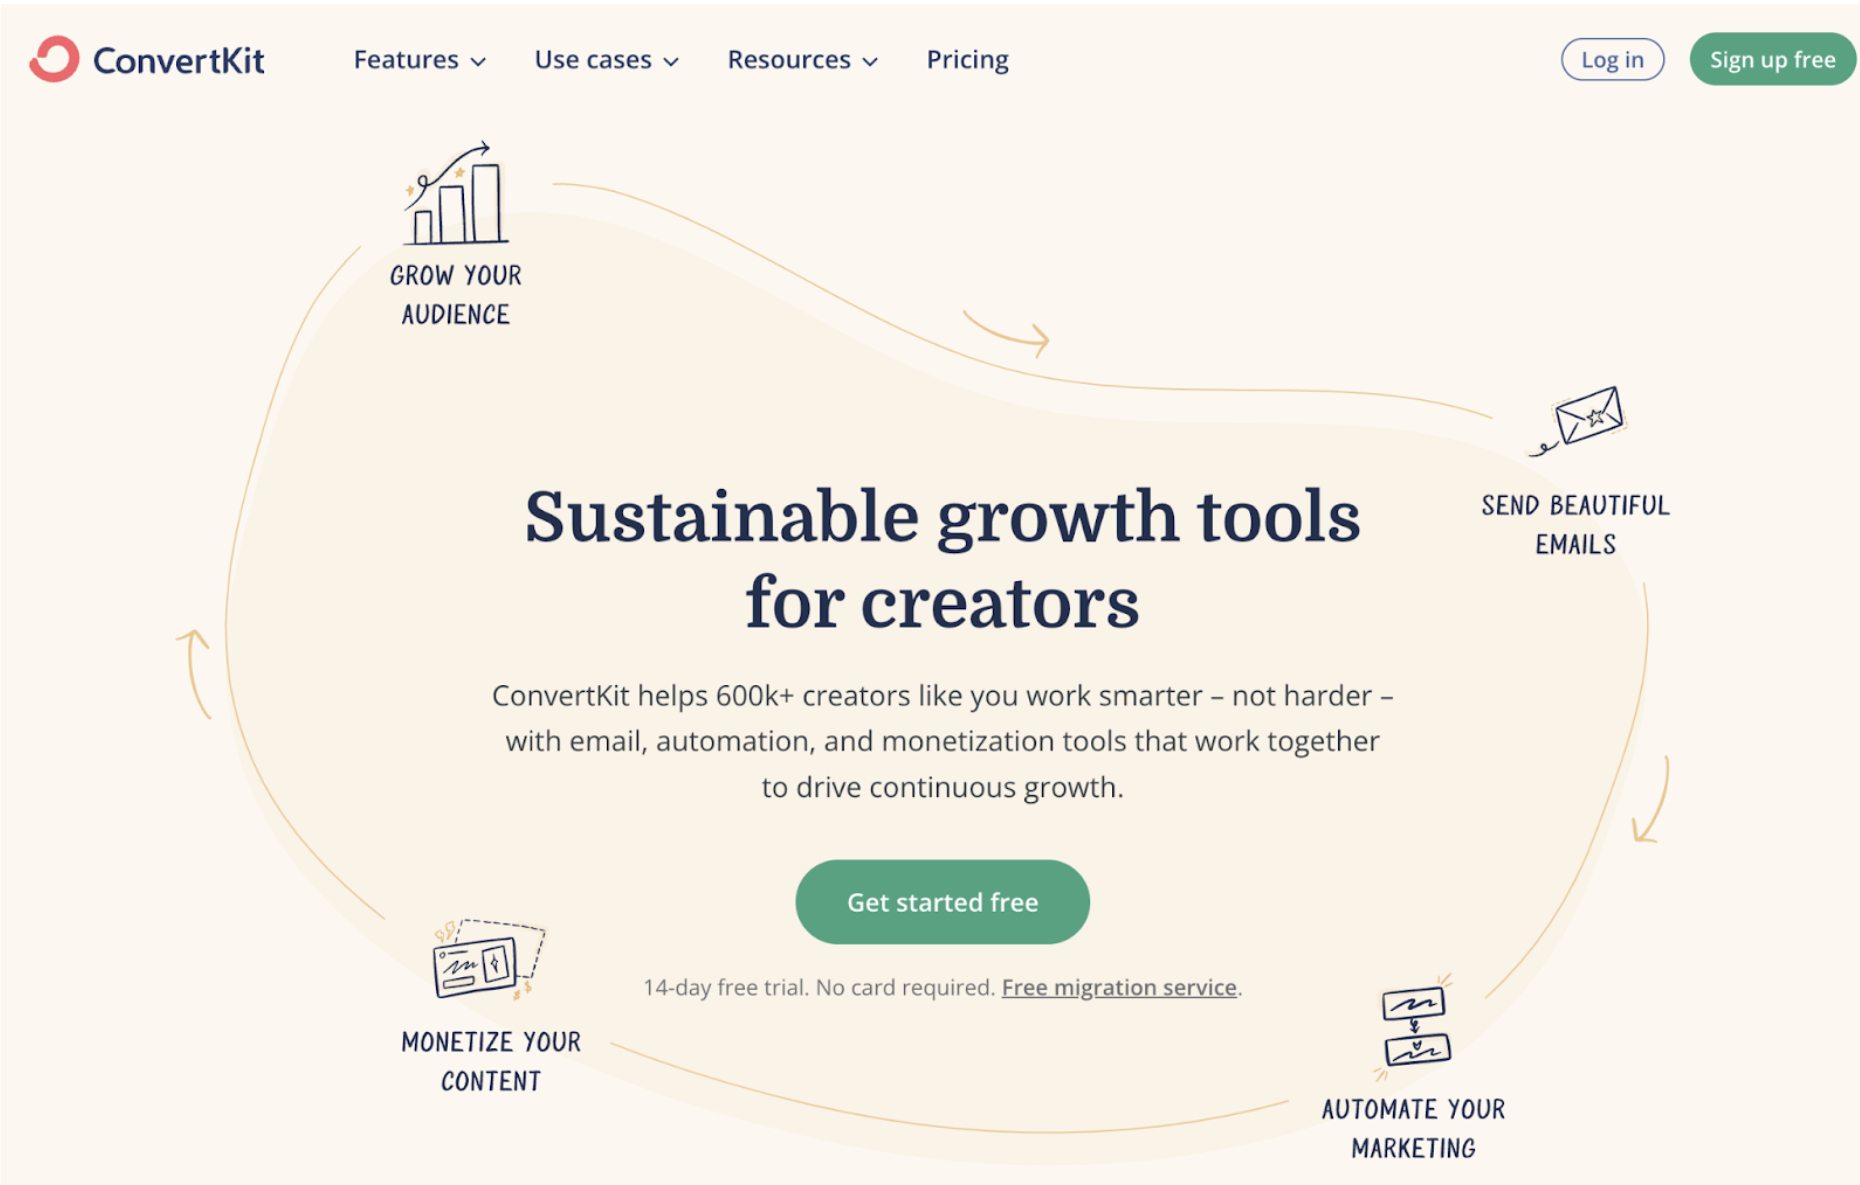
ConvertKit awesome home page graphic
ConvertKit’s homepage nails visual storytelling. Instead of dumping product features, it shows a “Creator Flywheel” that instantly explains how the...
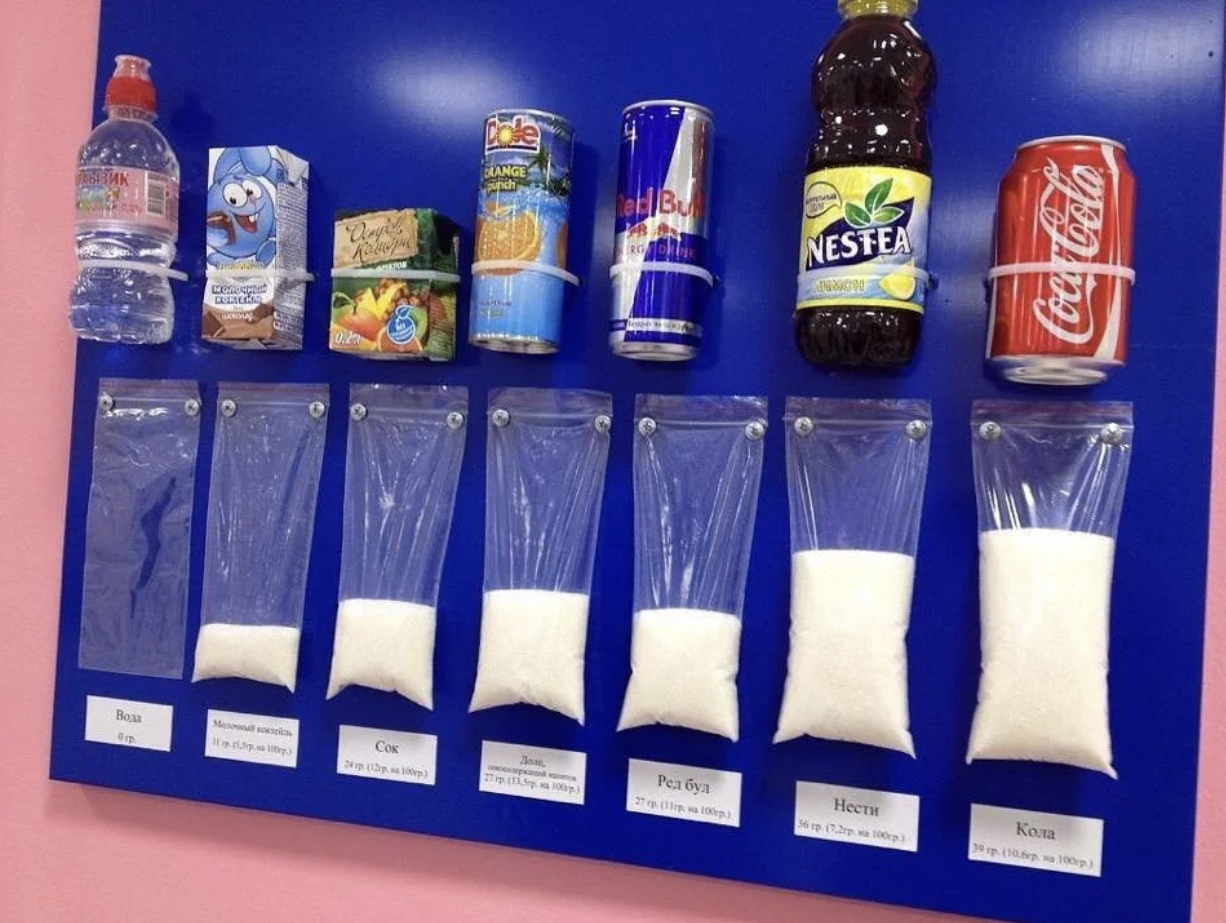
Show, Don’t Tell. But with Sugar.
Ever read a label that says “39g of sugar” and not thought twice?Now look at this image. Each drink is...
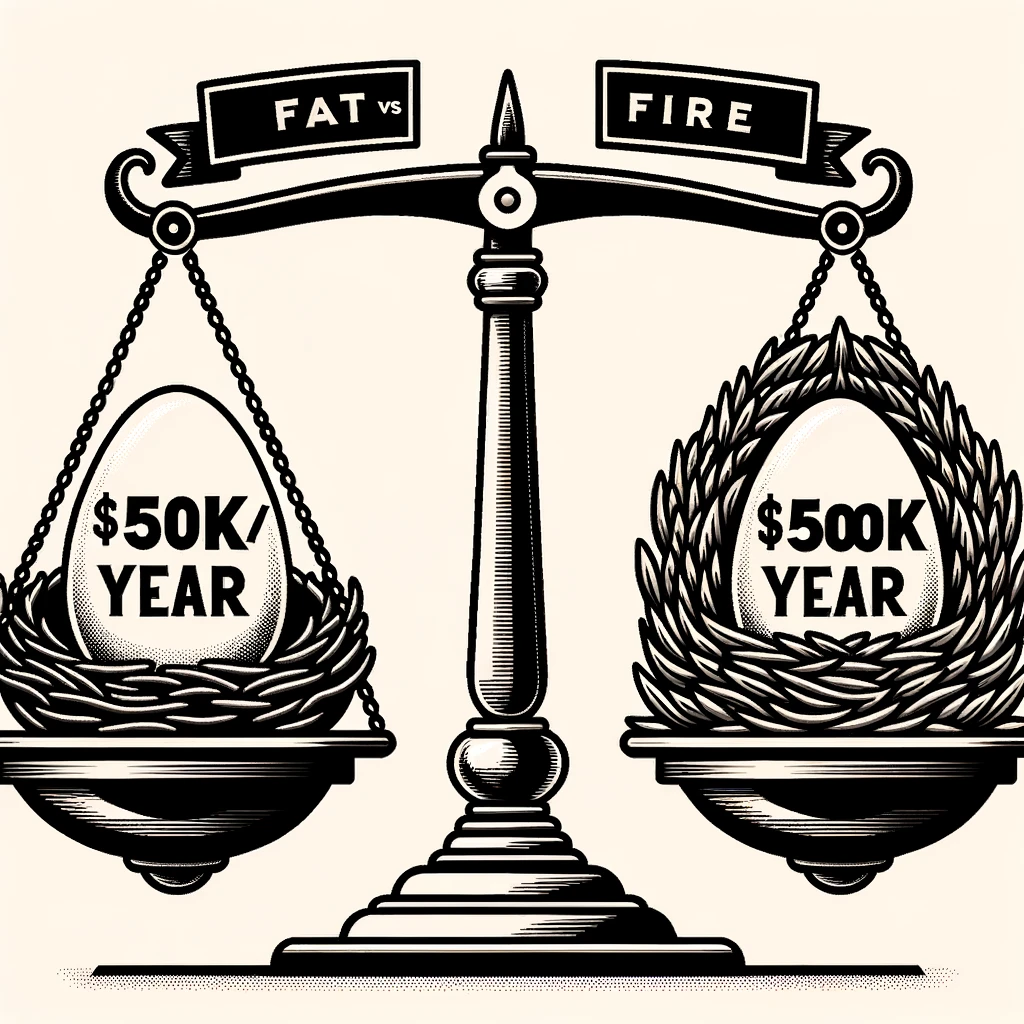
FAT-FIRE
This image nails a brilliant marketing difference: same dream, bigger payoff. Everyone knows FIRE (Financial Independence, Retire Early), but FAT-FIRE...
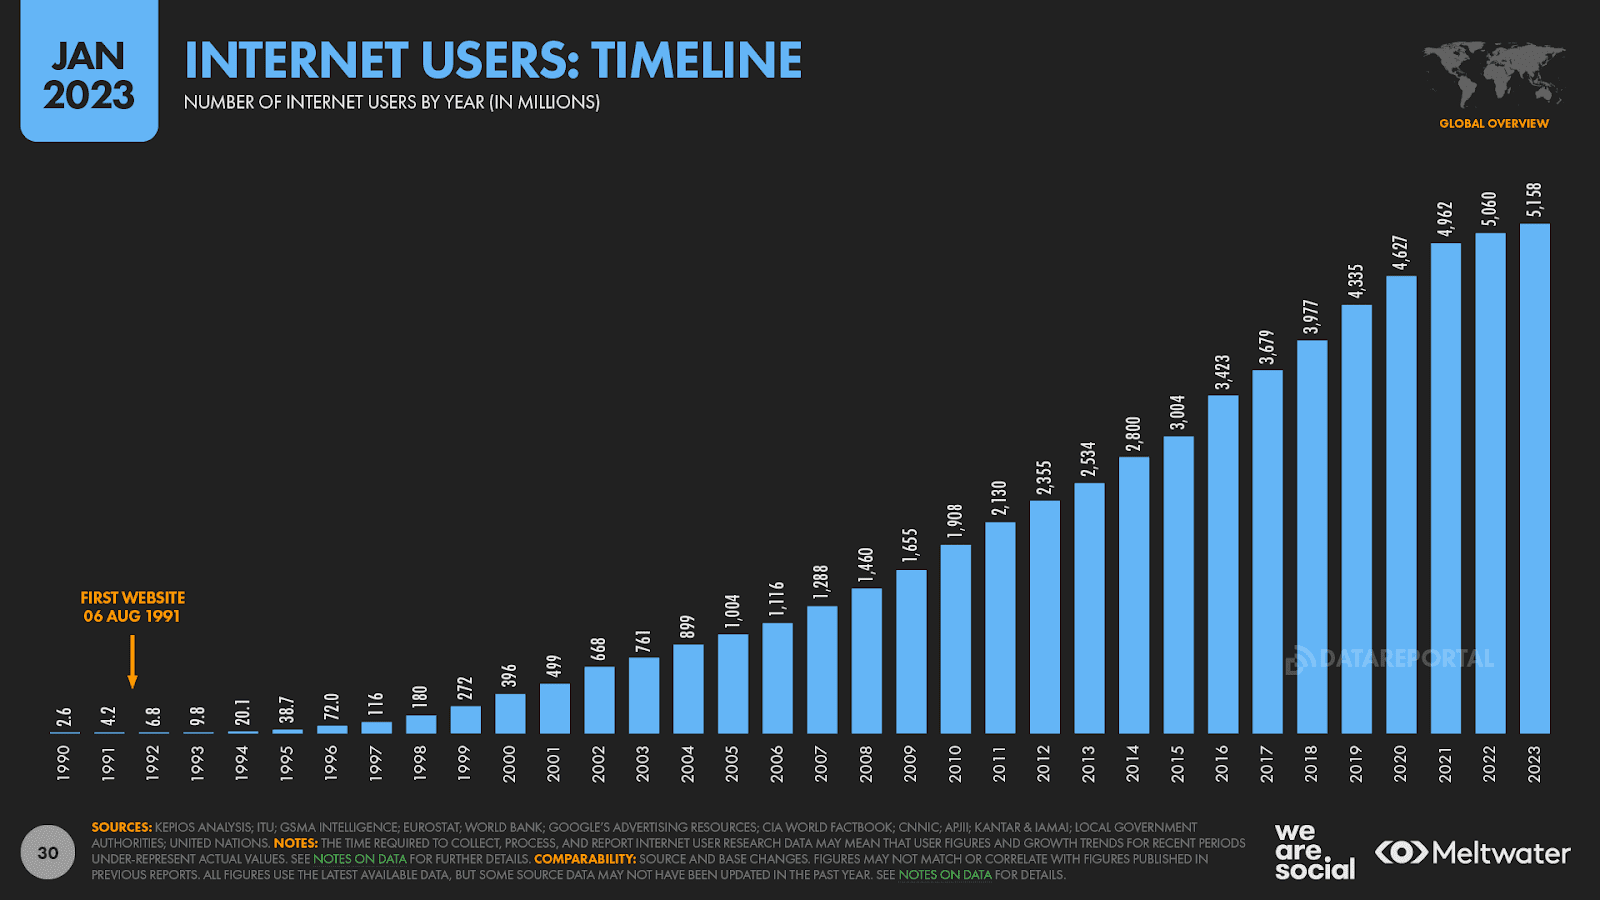
Internet Users Over Time
This chart shows internet users exploding from 2.6 million in 1990 to over 5 billion in 2023. In 2003, only...

Boring industry Excel before/after
Datarails nails the visual transformation game. One side is messy spreadsheets. The other? A clean, visual dashboard that screams “efficiency.”...
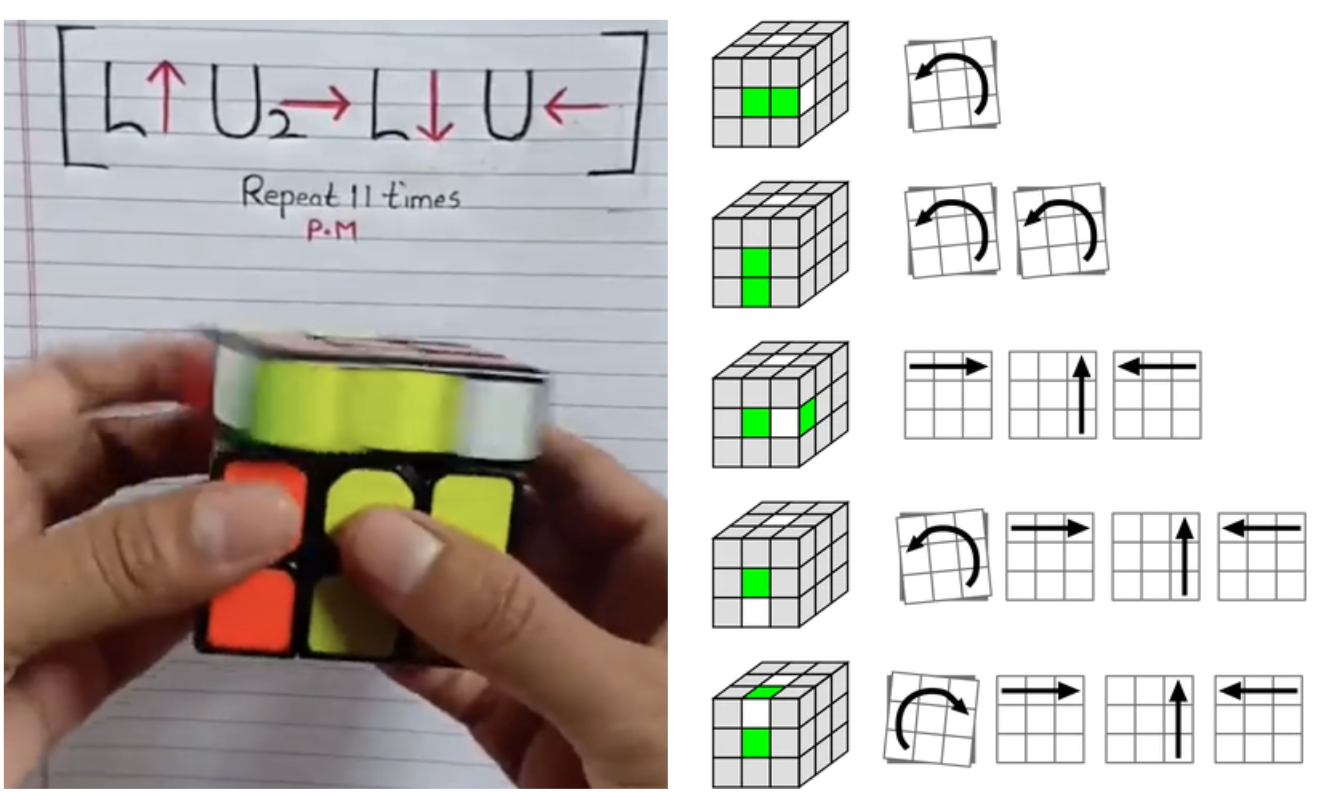
Rubiks Cube Formula
Someone found a way to “solve any Rubik’s Cube” using just four moves repeated 11 times. Pure magic, right? Actually,...
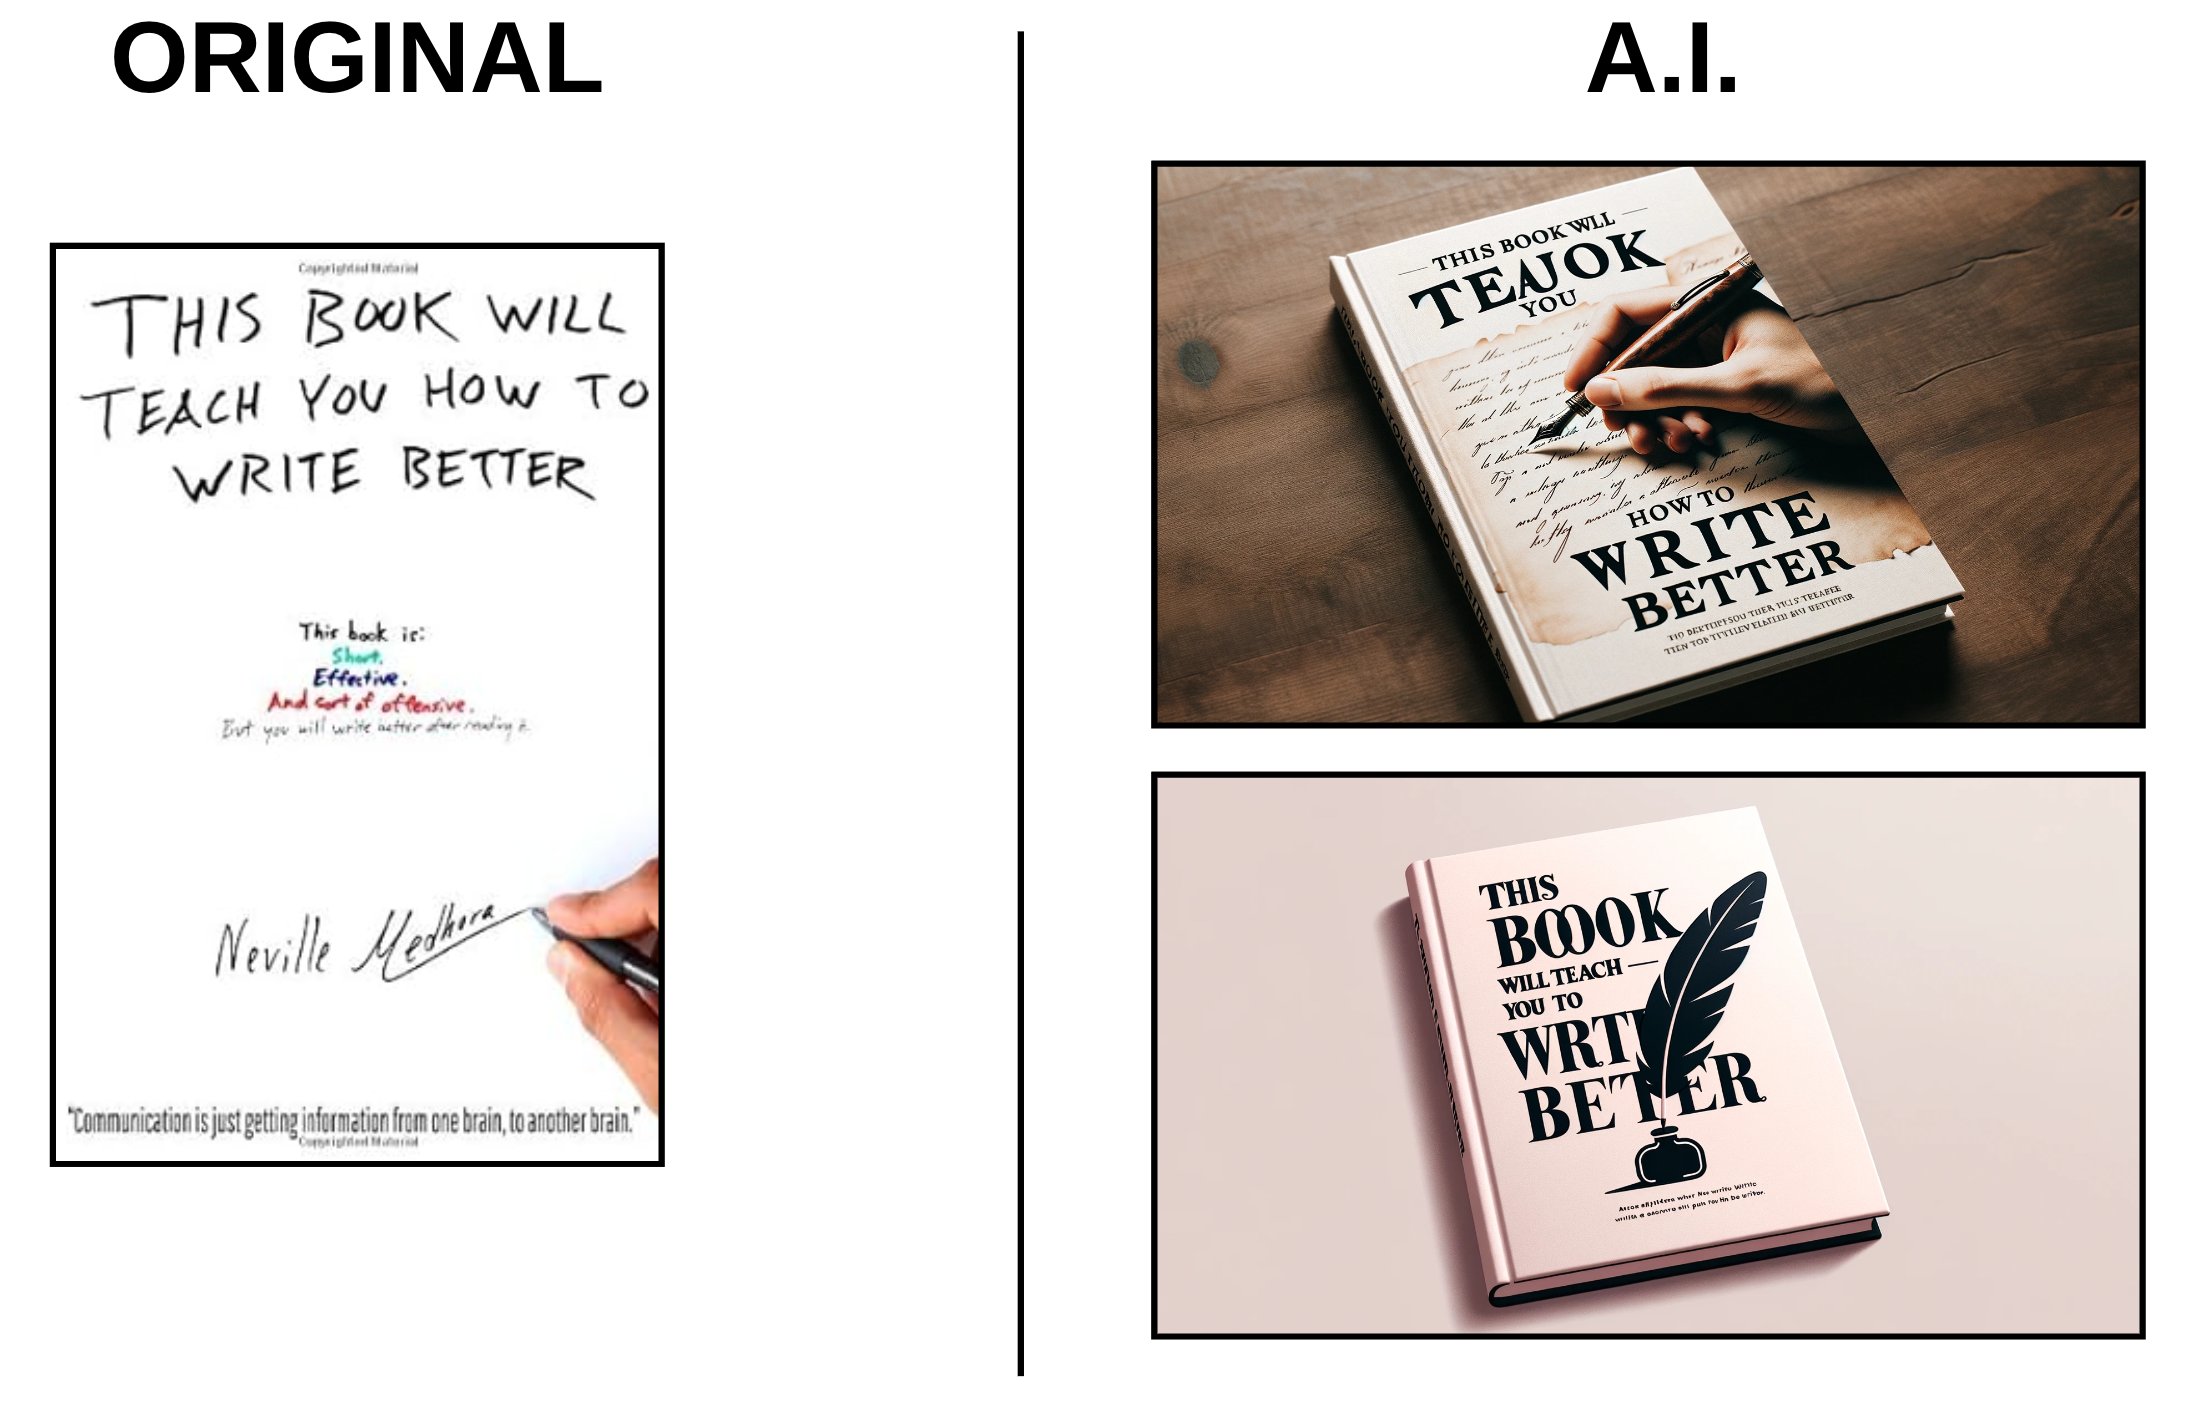
"Dall-E 3" image generator
OpenAI’s DALL·E 3 just made it stupid-easy to visualize marketing ideas. The images above show how AI reimagined banners, logos,...

Where the ultra-rich spend their holidays
This visualization mapping where the ultra-rich spend their holidays says a lot about aspiration marketing. The top five? Miami, The...
Before & After photos are awesome
Commit Action nails the art of “Before & After” storytelling. Their coaching ads turn fuzzy benefits (like “get clarity”) into...

Best party crashing advice
Ever notice how some people can just walk into any room and instantly fit in? The image above nails it....
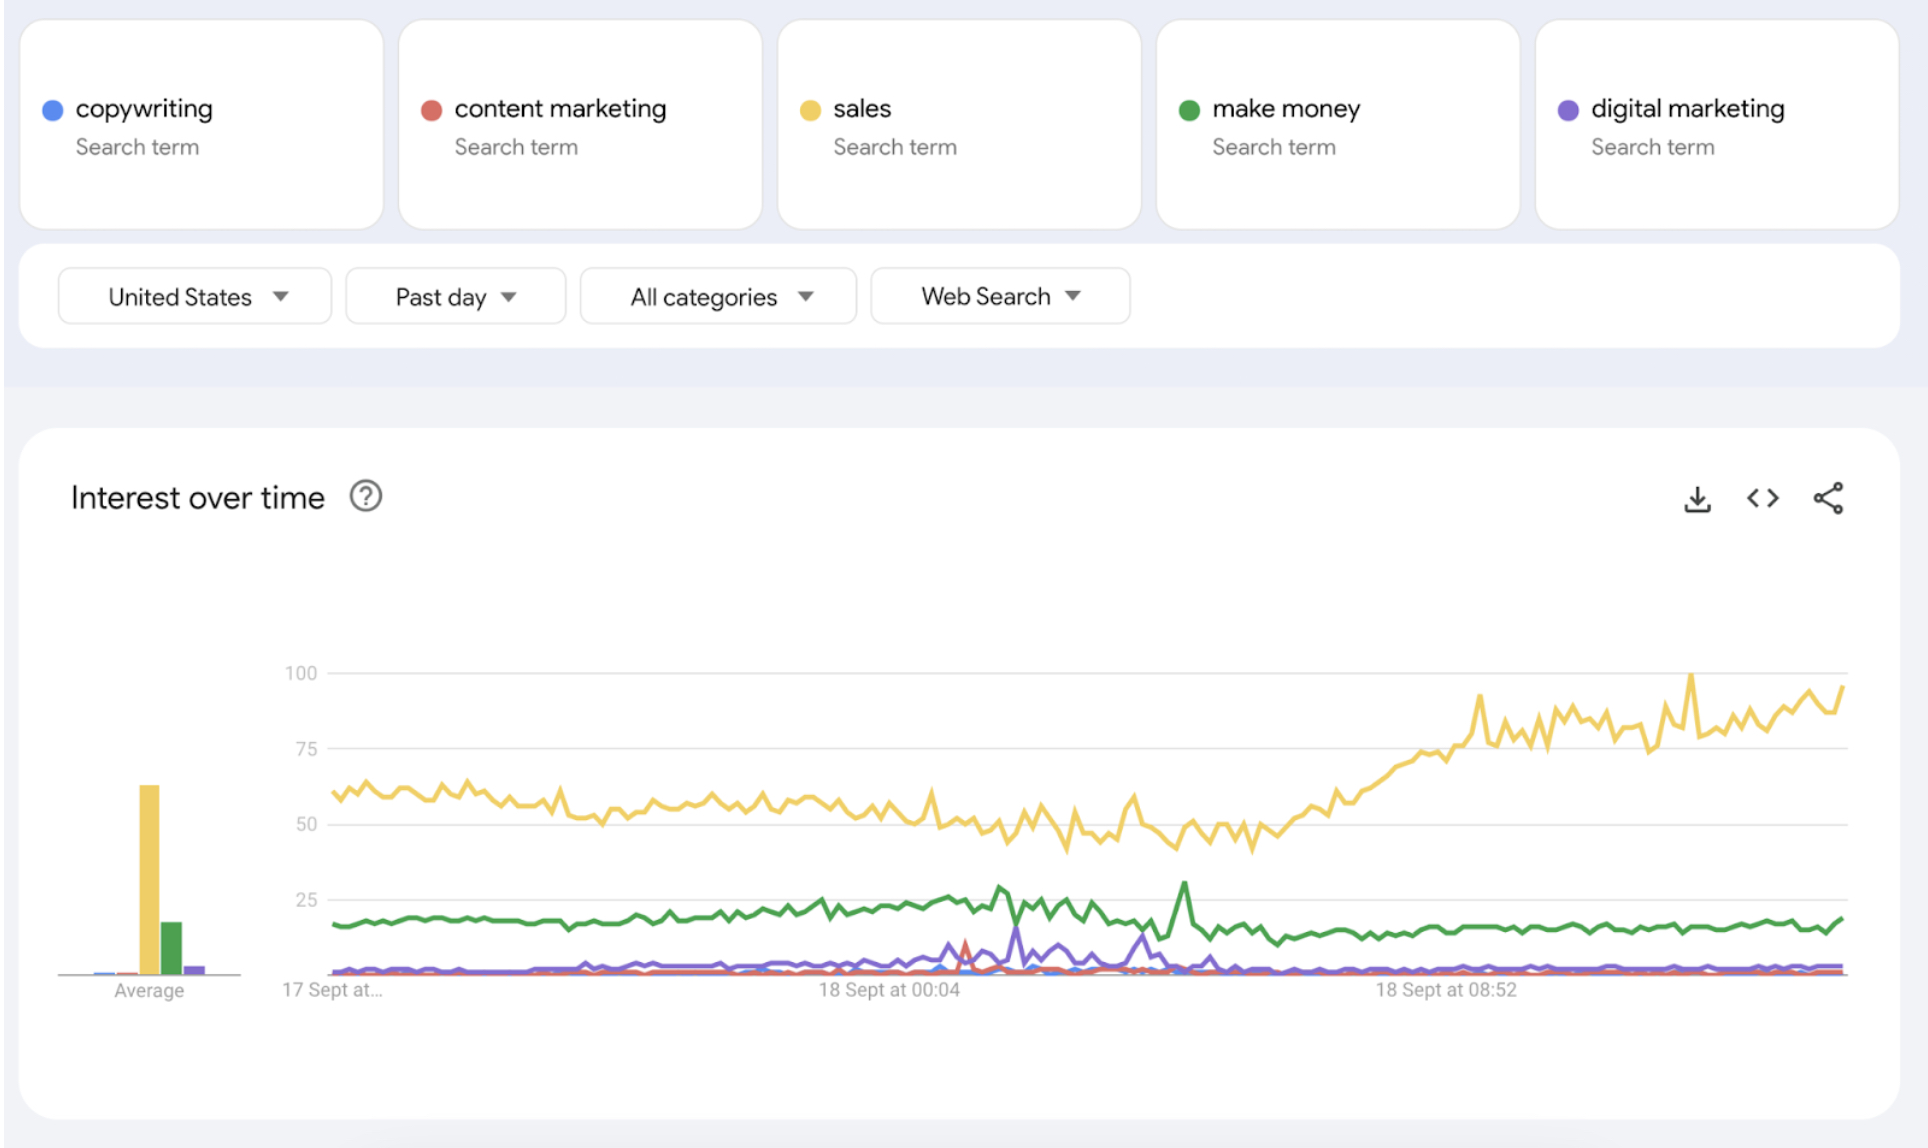
Copywriting industry size by keyword
This Google Trends chart tells a clear story. “Sales” crushes every other marketing term — “make money” lags behind it,...
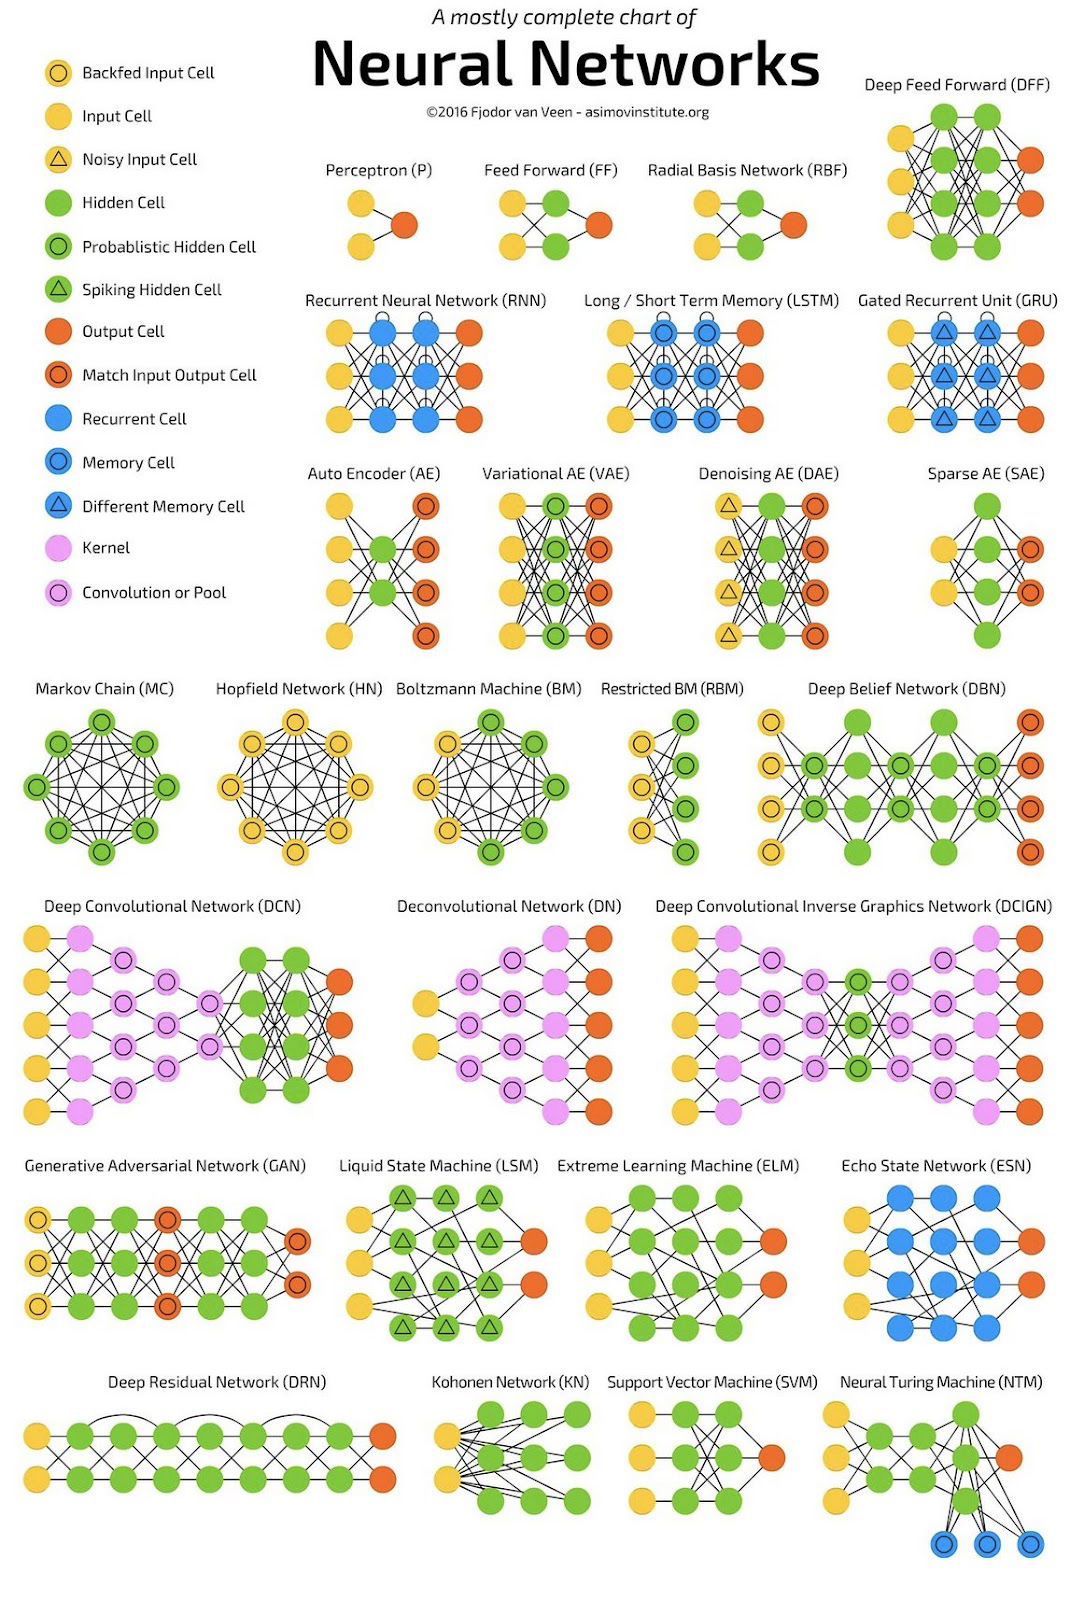
Neural network structures chart
This colorful chart of neural networks looks like computer science artwork. But hidden inside it is a killer marketing lesson:...
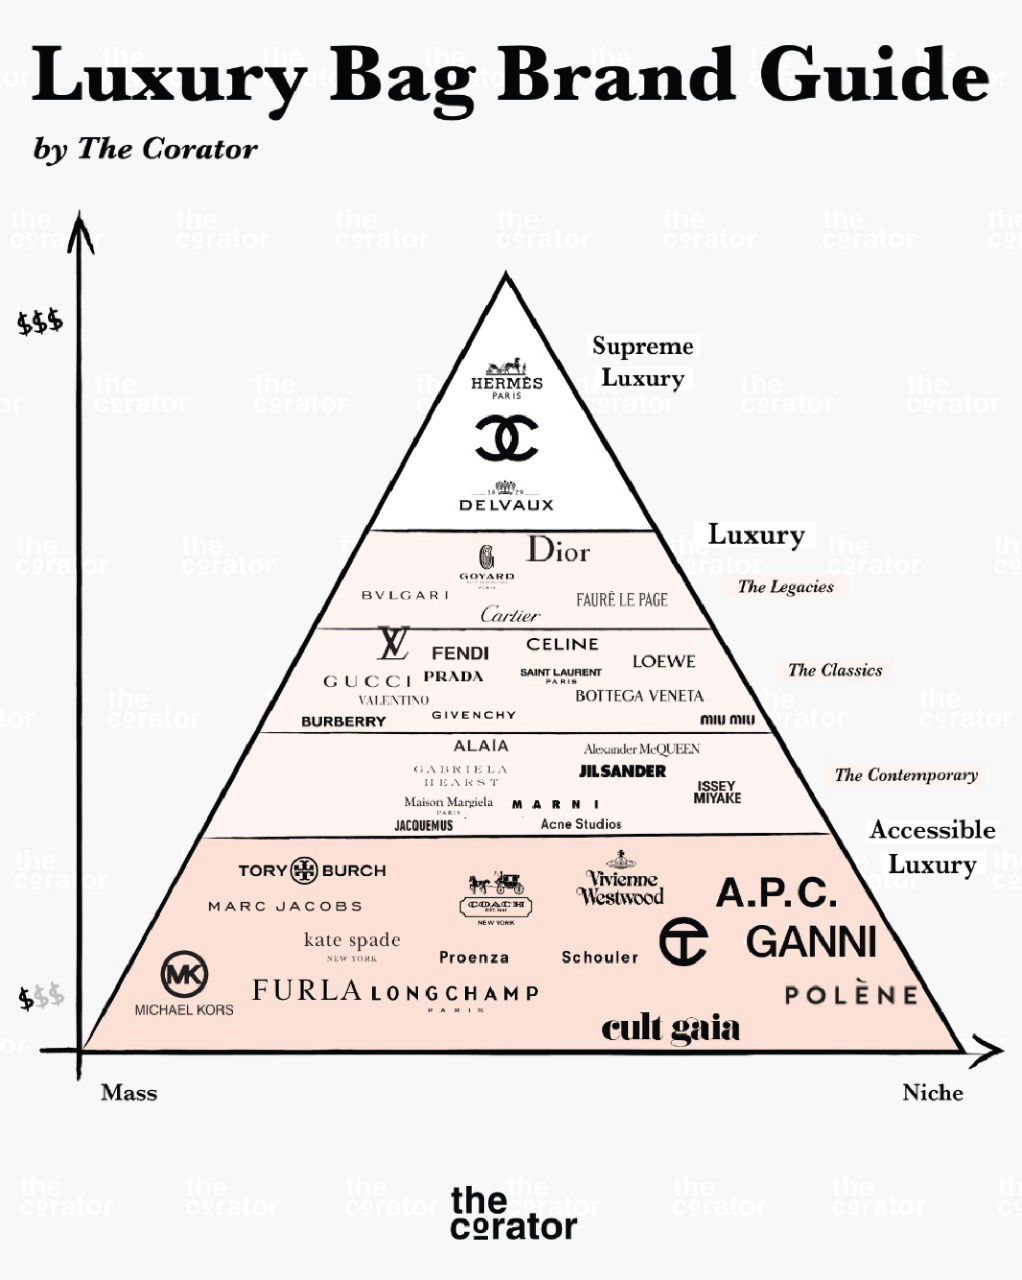
Luxury Bag Pyramid
The “Luxury Bag Brand Guide” by The Curator is viral because it hits a simple marketing truth: people love to...
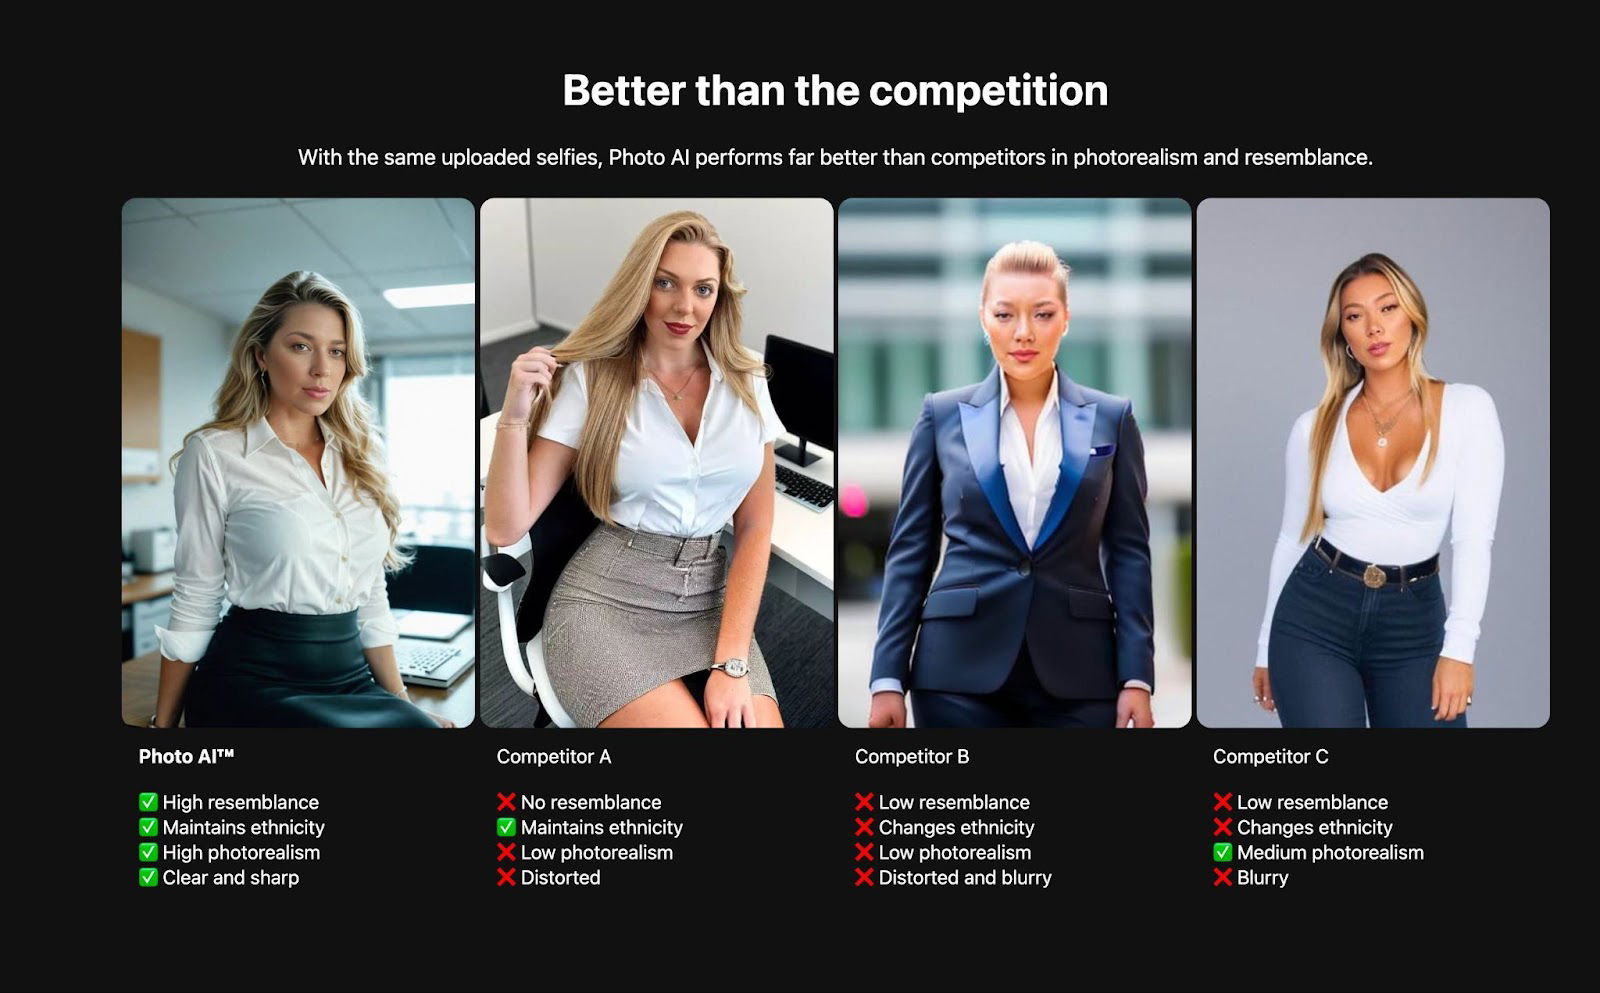
PhotoAI.com product comparison image
PhotoAI nails one of marketing’s golden rules: show it, don’t tell it. Instead of bragging about “better image quality,” they...

CEO of NetFlix naming strategy
Back when Netflix was just an idea, Marc Randolph scribbled down some potential names on a yellow notepad. This list...
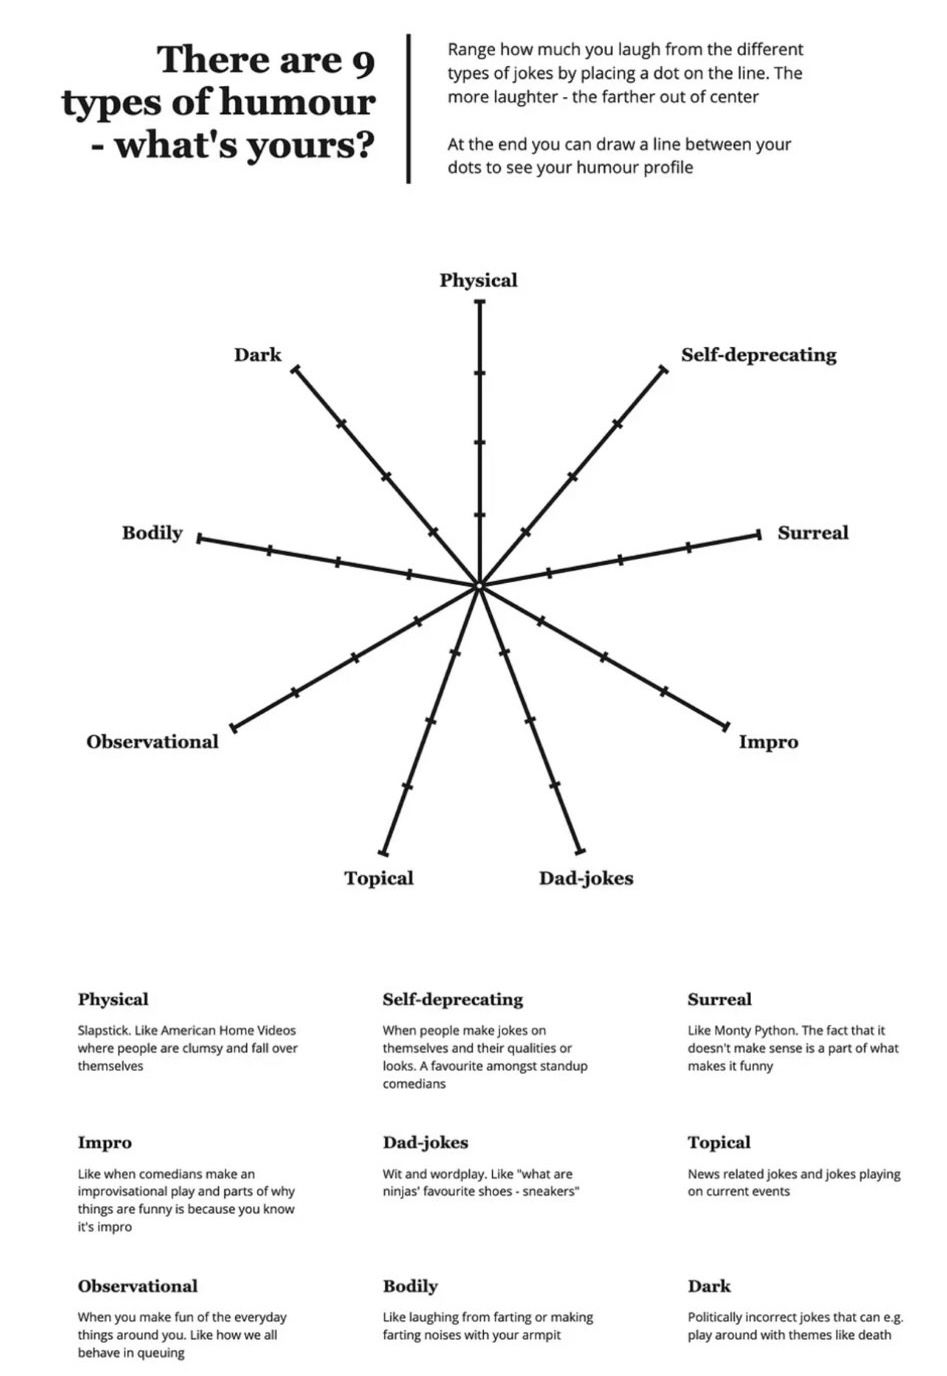
Different types of humor breakdown
Ever wonder why some jokes crush on Twitter while others flop? This chart breaks down the 9 types of humor—and...