2,048 Images and Illustration Examples That Teach Things
Drawings and illustrations and photography can transmit more information from human-to-human than text can. This board is perfect for designers and marketers seeking visual inspiration.

This chart from Visual Capitalist instantly shows how population power has shifted worldwide. You could write a thousand words about...
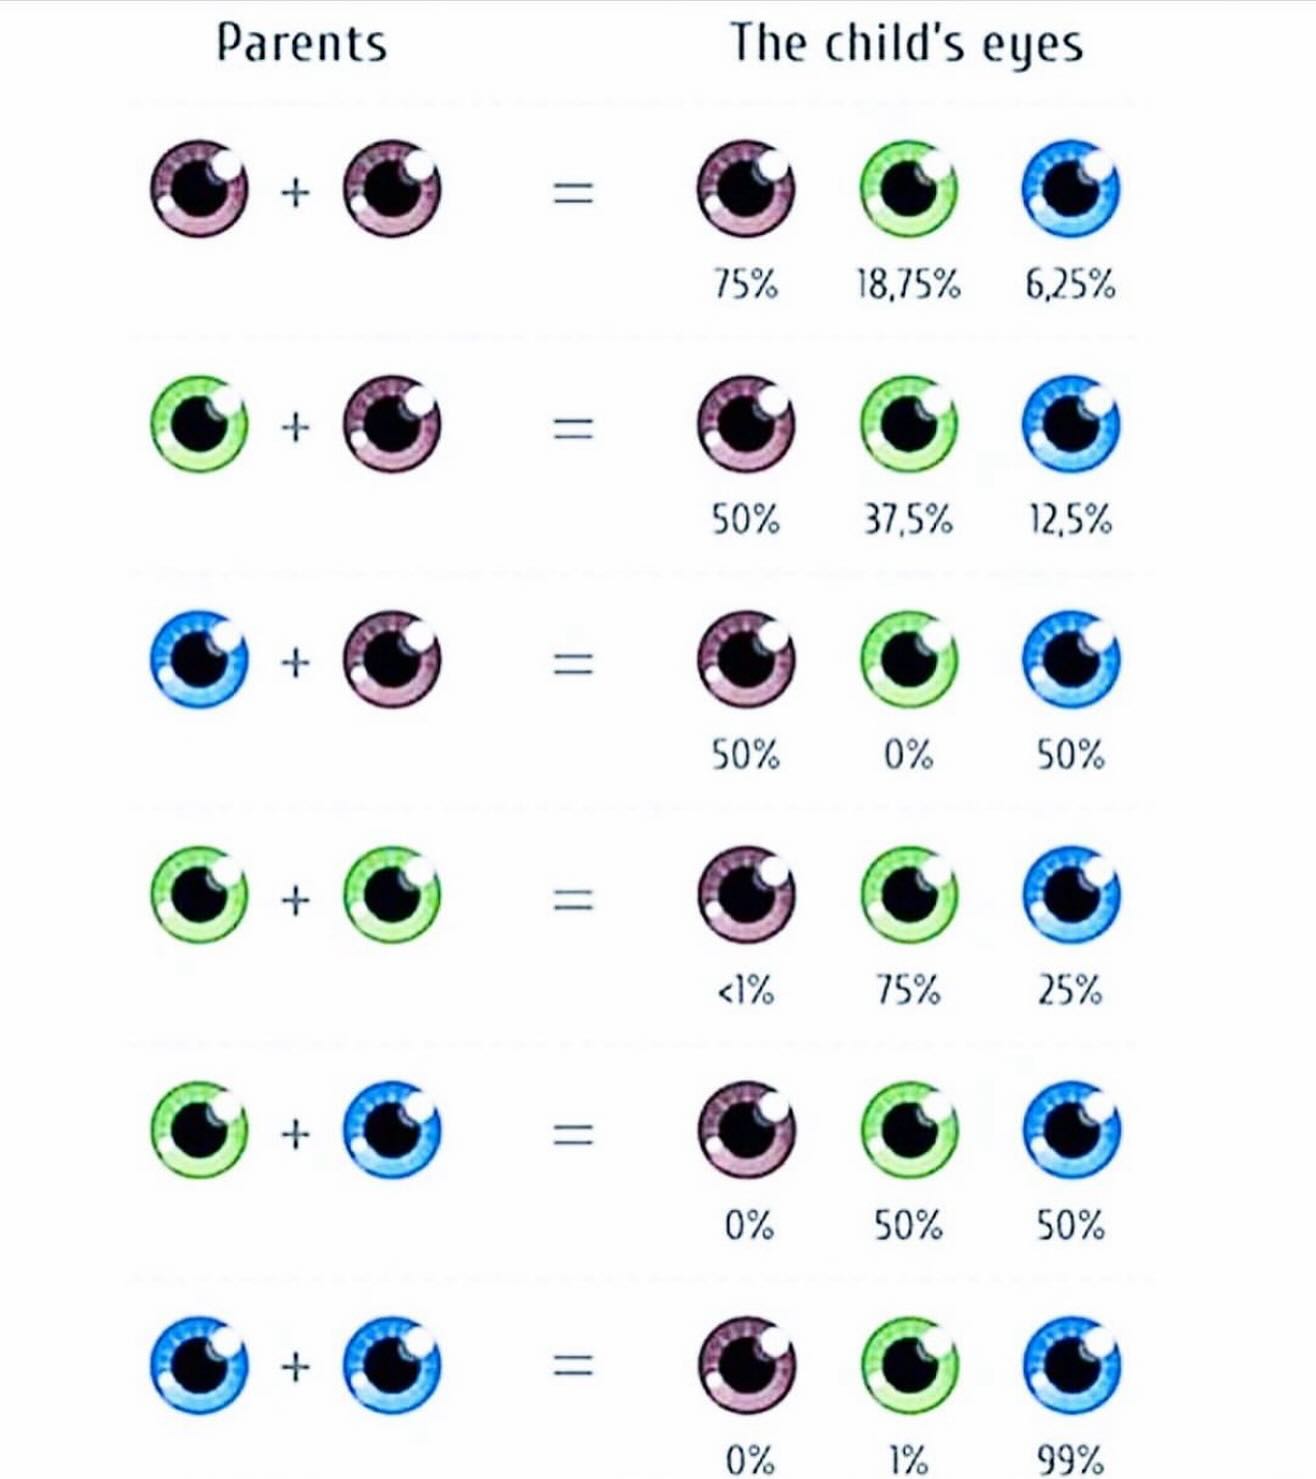
This eye color chart is a masterclass in visual simplicity. It takes a complex genetic concept and turns it into...
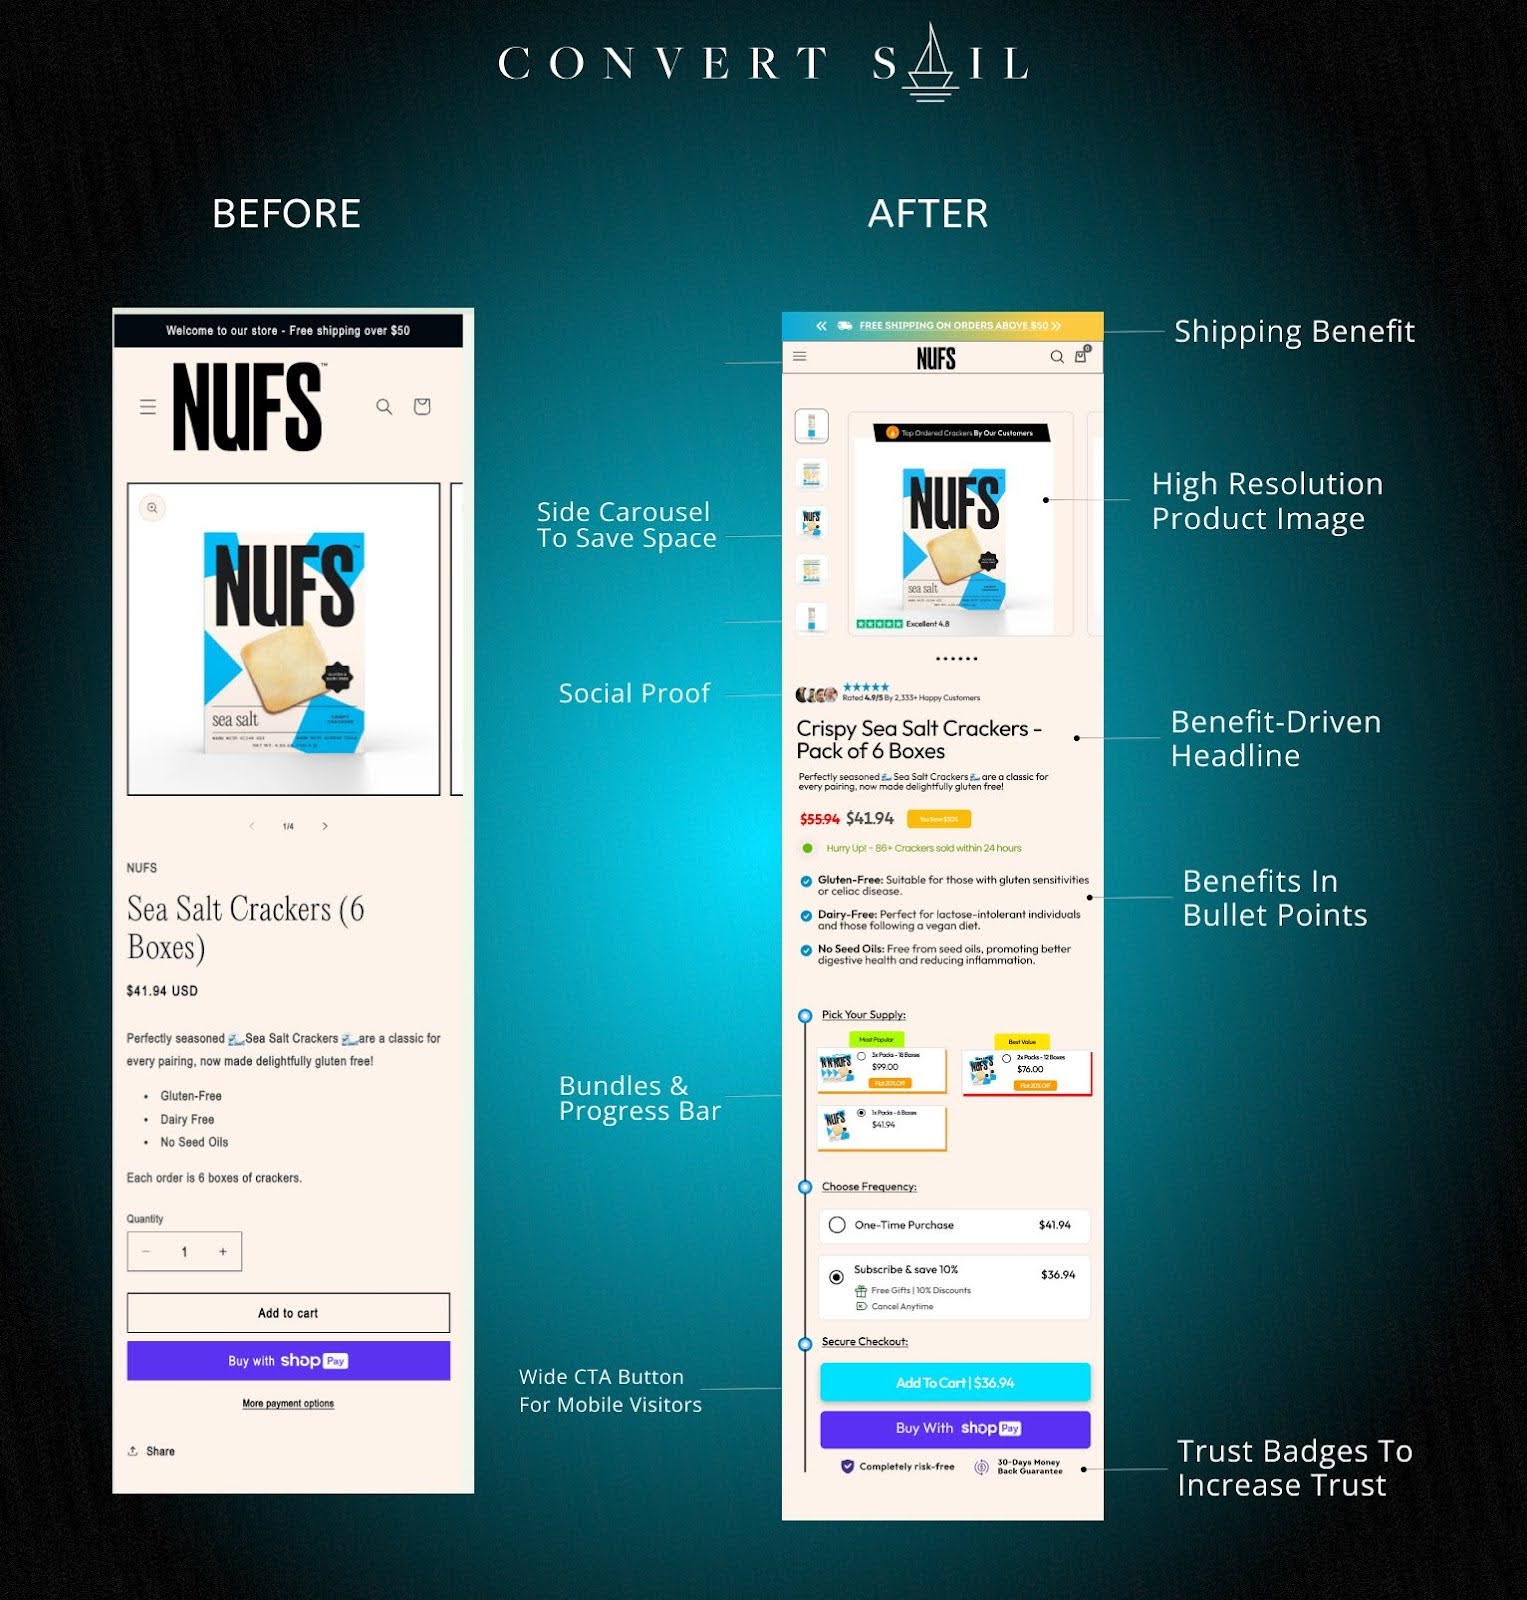
NUFS redesigned their cracker product page and saw conversion rates jump. The tweaks weren’t fancy—but they nailed basic sales psychology...
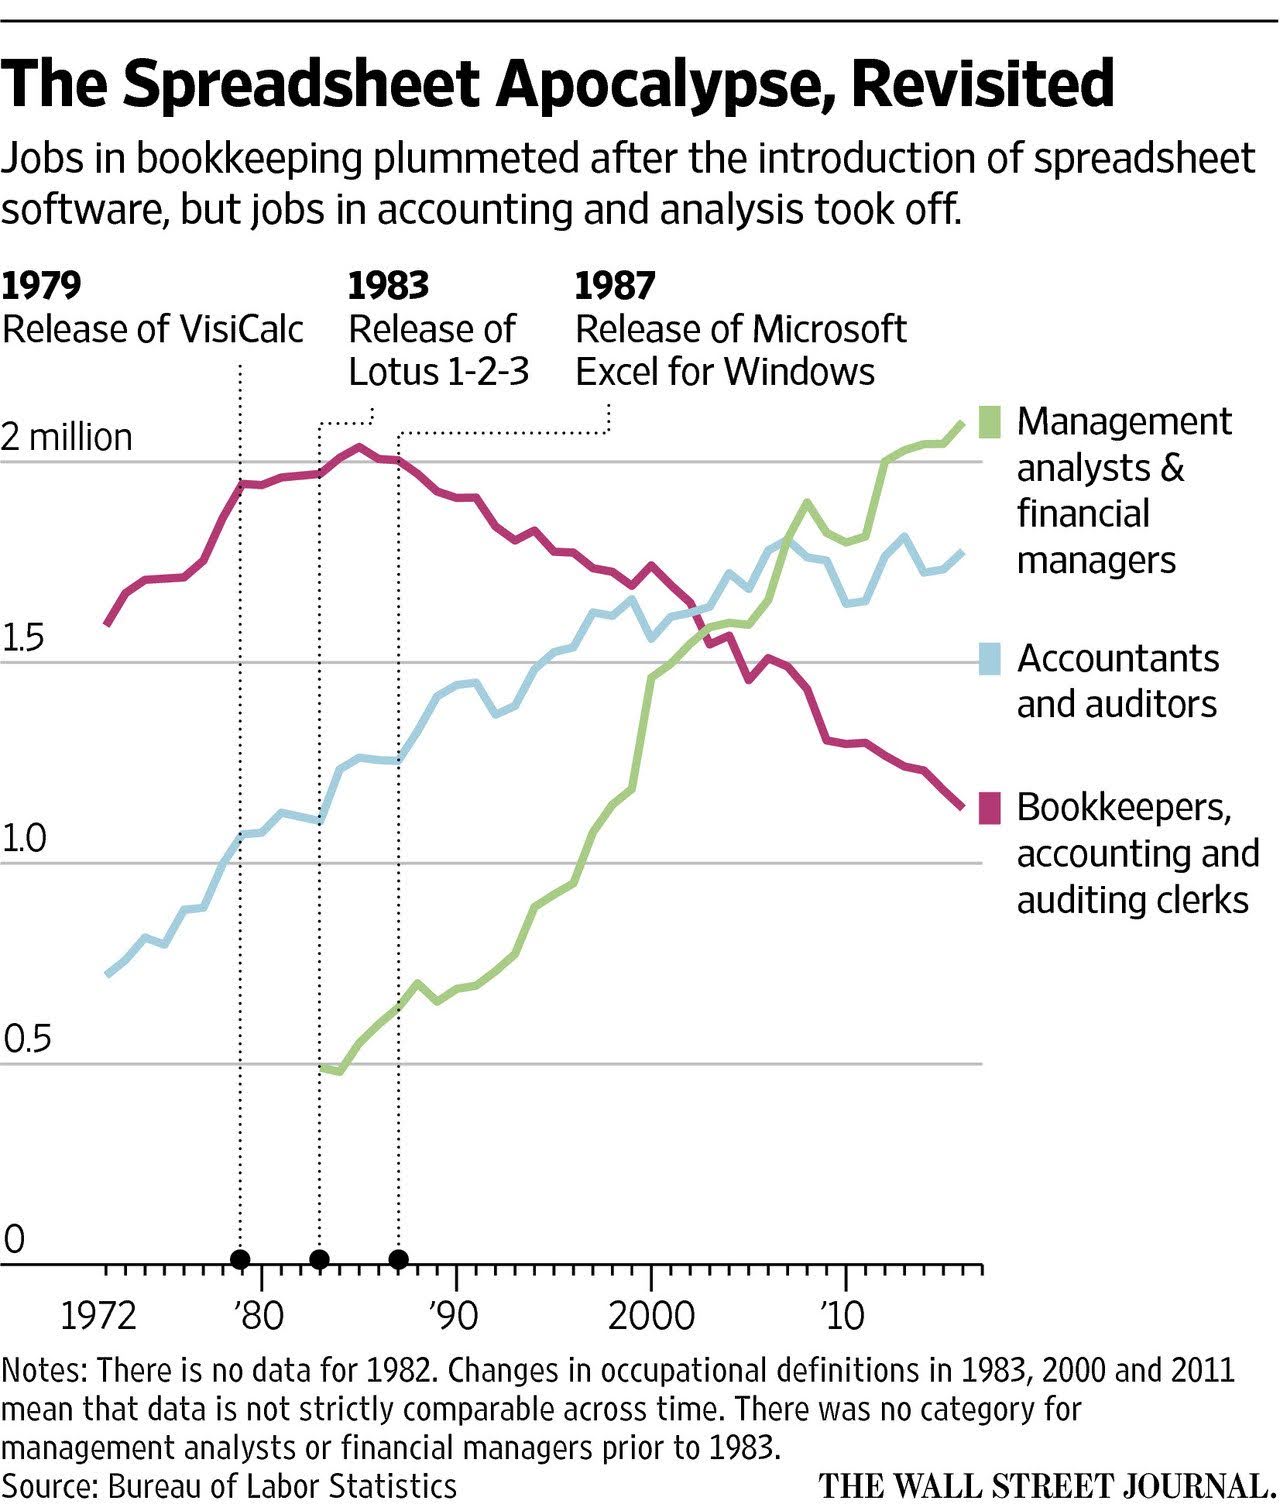
This graph shows how spreadsheets “killed” bookkeeping jobs but unlocked way more high-value roles in analysis and management. Every big...

Every marketer knows this chart is too real. You start out thinking your campaign idea is genius... then halfway in,...
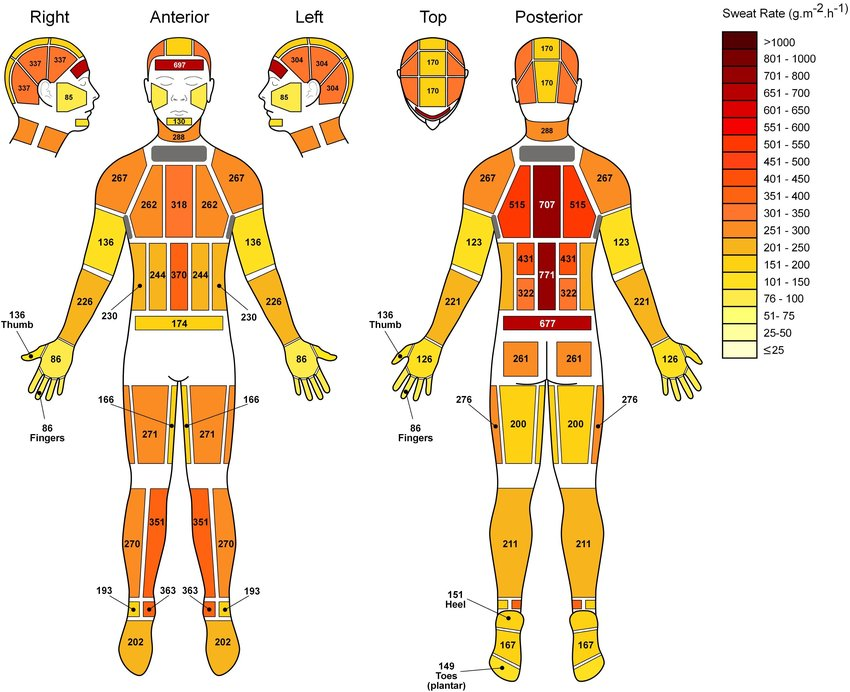
Here’s a weirdly satisfying visual: a full-body sweat map showing exactly where humans sweat the most. It looks scientific, but...
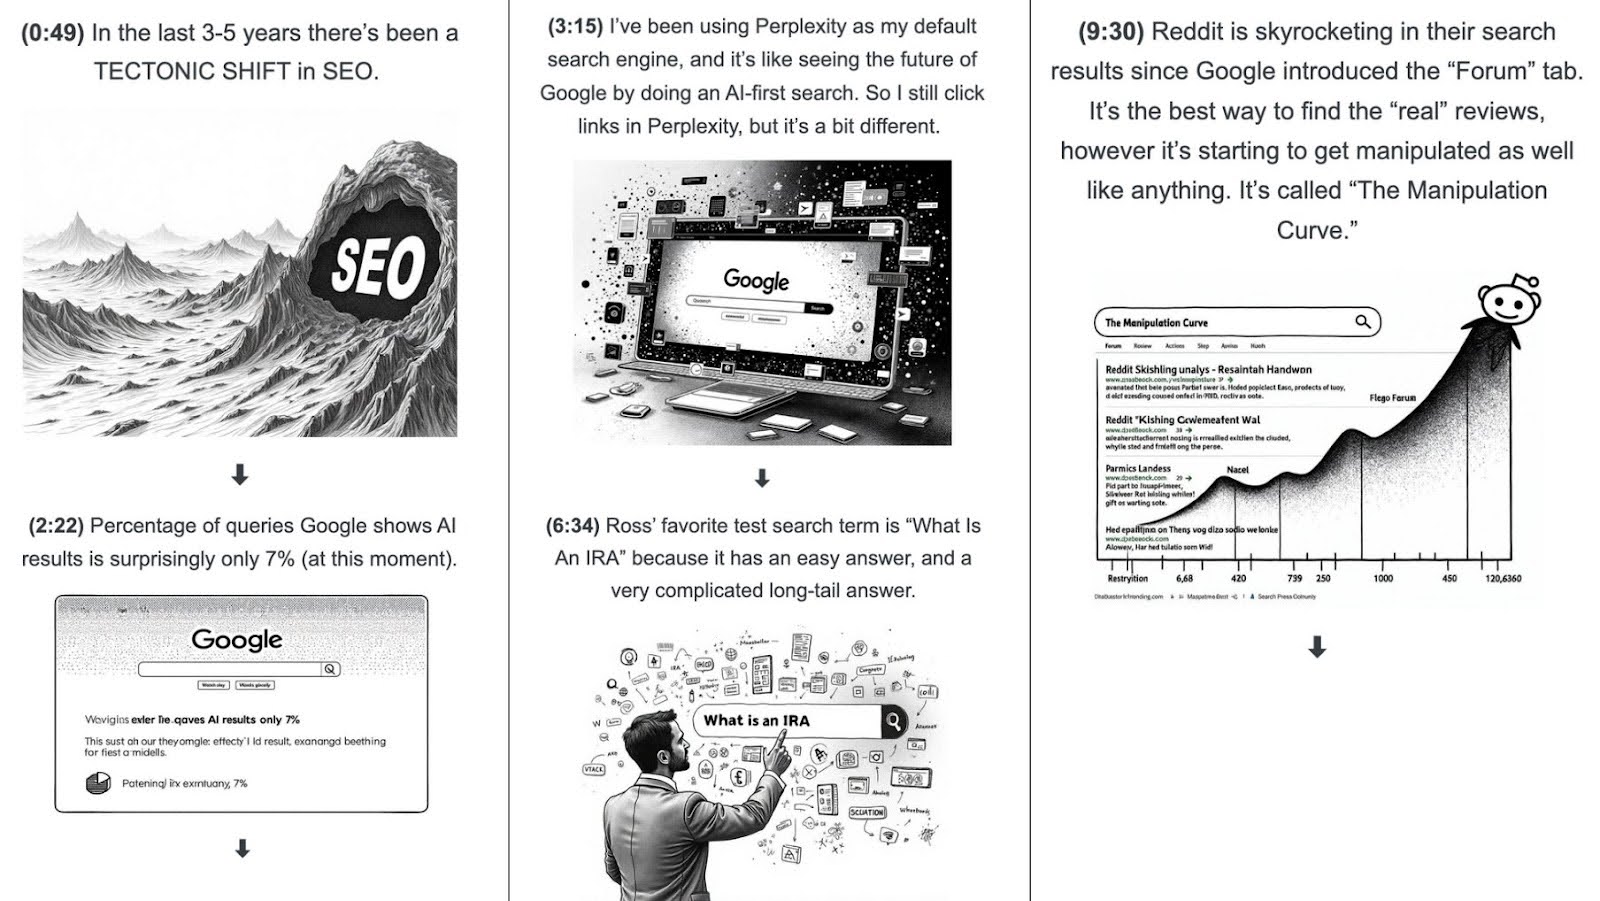
This “Visual Shownotes” from a Copywriting Course interview makes complex SEO talk digestible and binge-worthy. Instead of a boring transcript,...
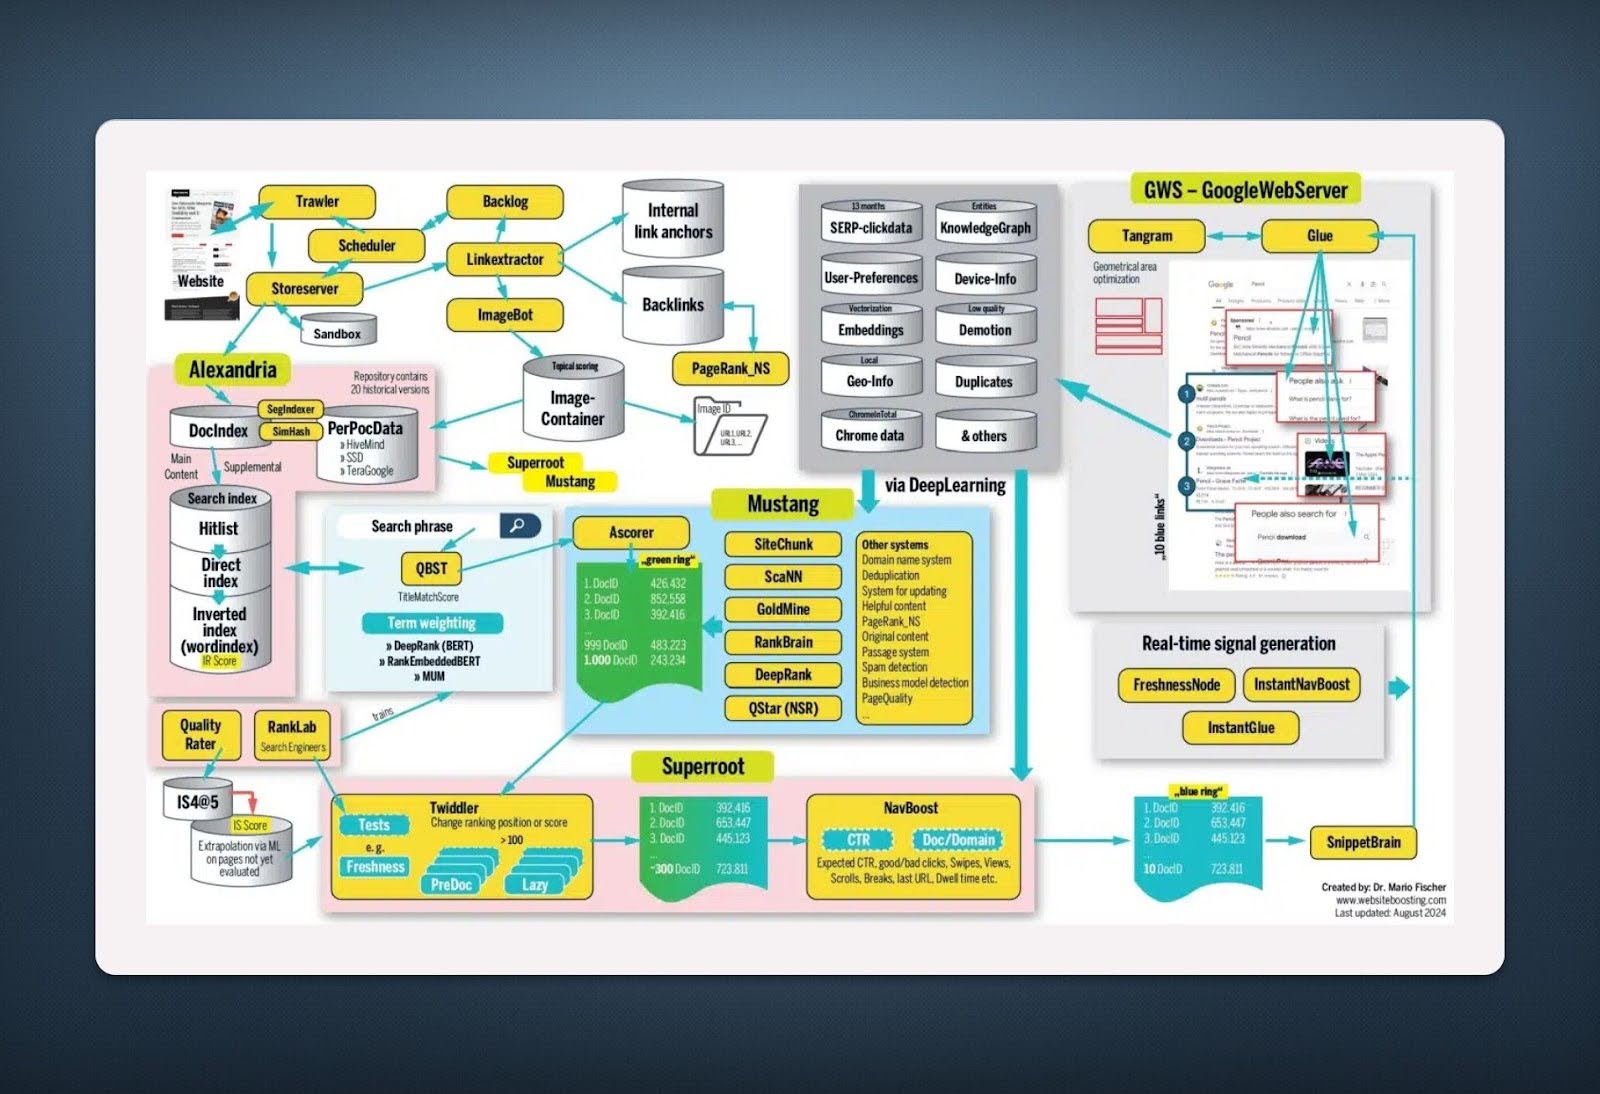
This flowchart looks like a spaceship control panel, but it’s actually how Google decides what shows up in search results....

This poster nails it. A laptop pitched like a tent in front of pink mountains instantly says “designers camping out...
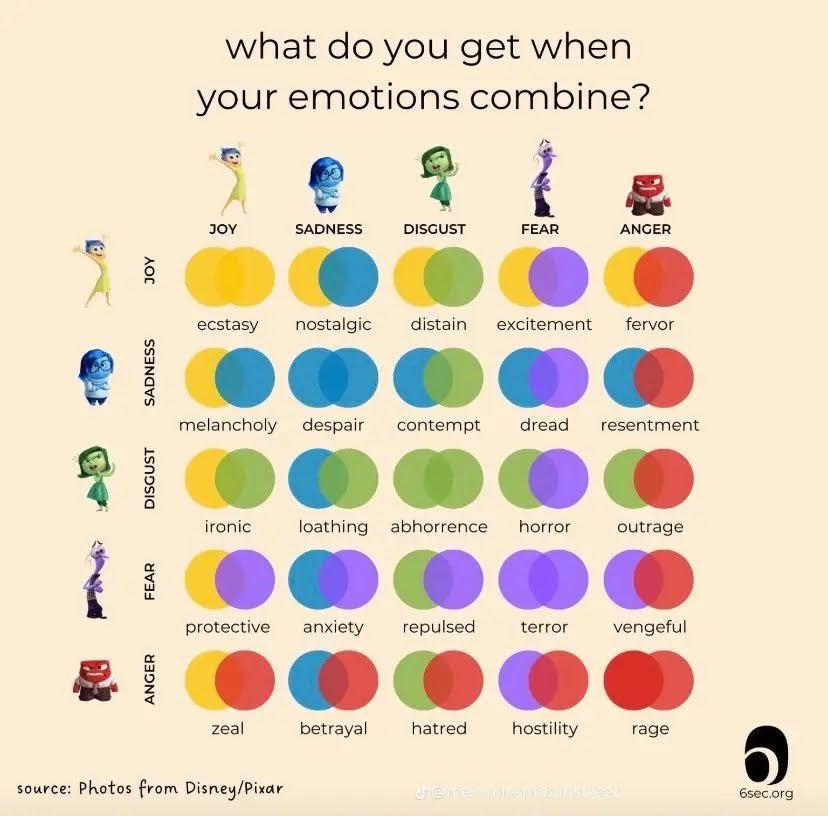
This “Inside Out” chart nails it: every emotion is powerful, but the magic happens when they mix. Marketers who understand...

Bartlett Tree Experts nailed neighborhood marketing with this genius postcard. Instead of shouting “We’re the best,” they quietly show it—literally...
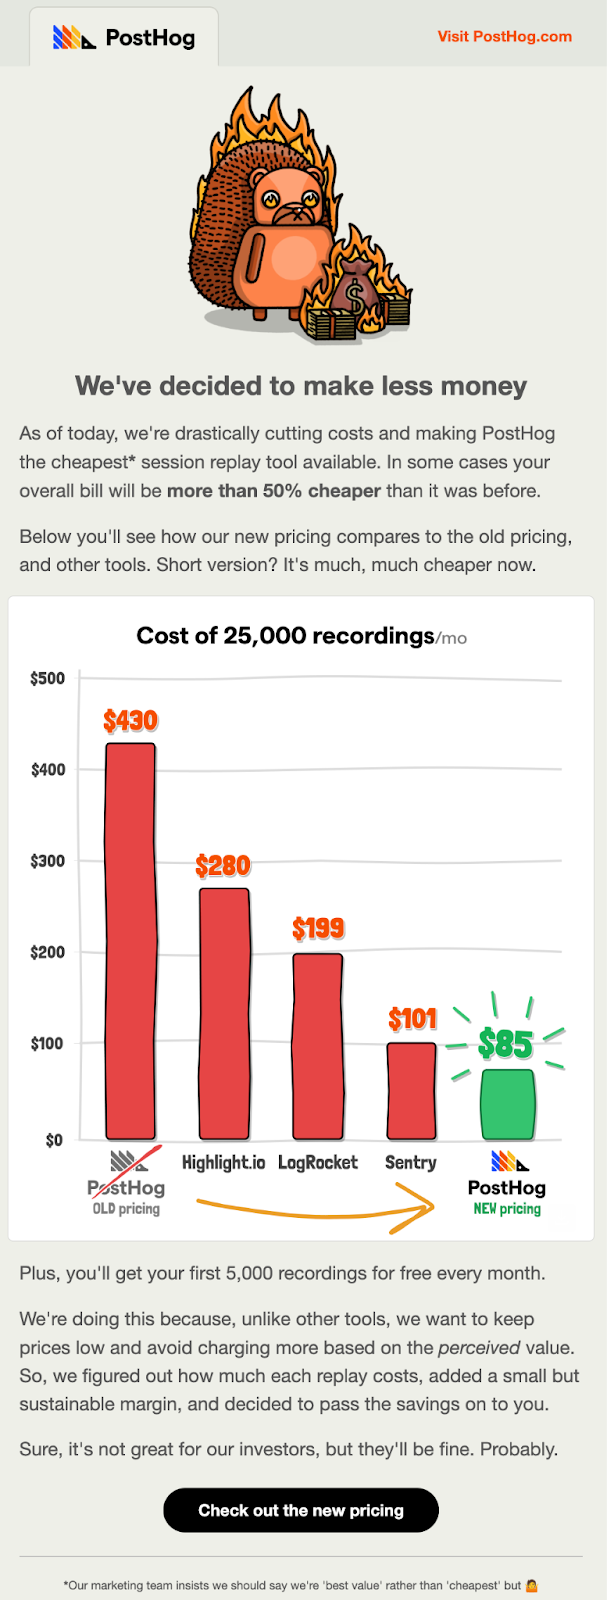
PostHog nailed this email. They didn’t just announce lower prices—they made it funny, visual, and insanely clear why it matters....

Check out this chart. It’s a rocket fuel visual of how human innovation and wealth exploded together. Every major tech...

This visual shows a goldmine: 40+ websites each pulling in $1M+ a year. From AI tools to Excel courses to...

Everyone loves a good launch. This chart of IPO market caps vs. current values shows how hype often outruns reality....


The Hampton redesign didn’t reinvent the wheel, but it sure polished it. The site went from dark and formal to...

Ever notice how big tech quietly swapped the gun emoji for water pistols? This chart shows how Apple, Google, Microsoft,...
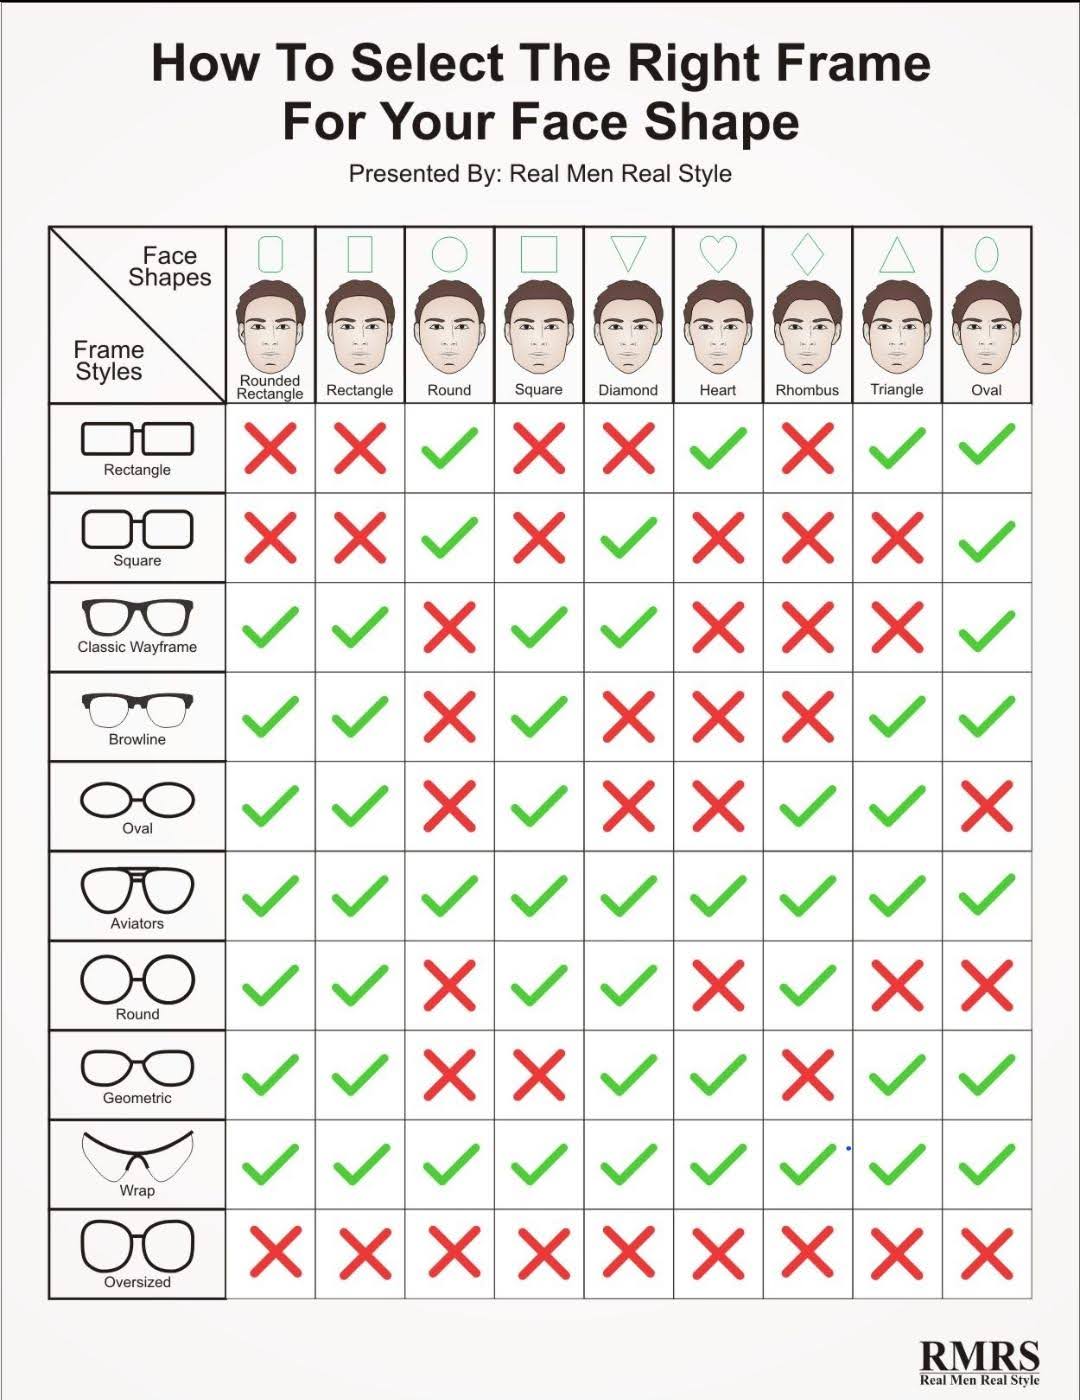
This chart by Real Men Real Style is marketing genius disguised as a style guide. It helps men instantly find...