2,048 Images and Illustration Examples That Teach Things
Drawings and illustrations and photography can transmit more information from human-to-human than text can. This board is perfect for designers and marketers seeking visual inspiration.
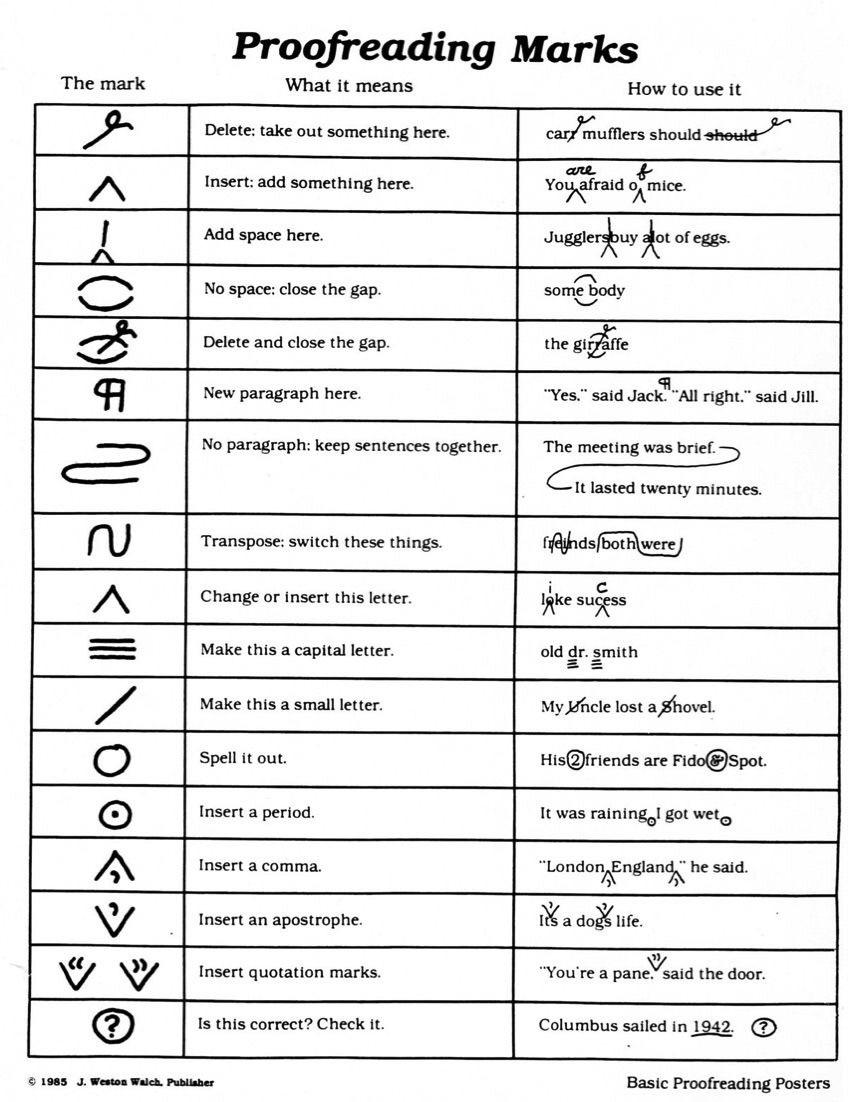
Before Grammarly, editors had their own visual language for fixing text—proofreading marks. Each curl, caret, and circle told writers exactly...

In 1989, Panasonic marketed something wild — a VCR you could call to record your shows. Forget your timer? No...
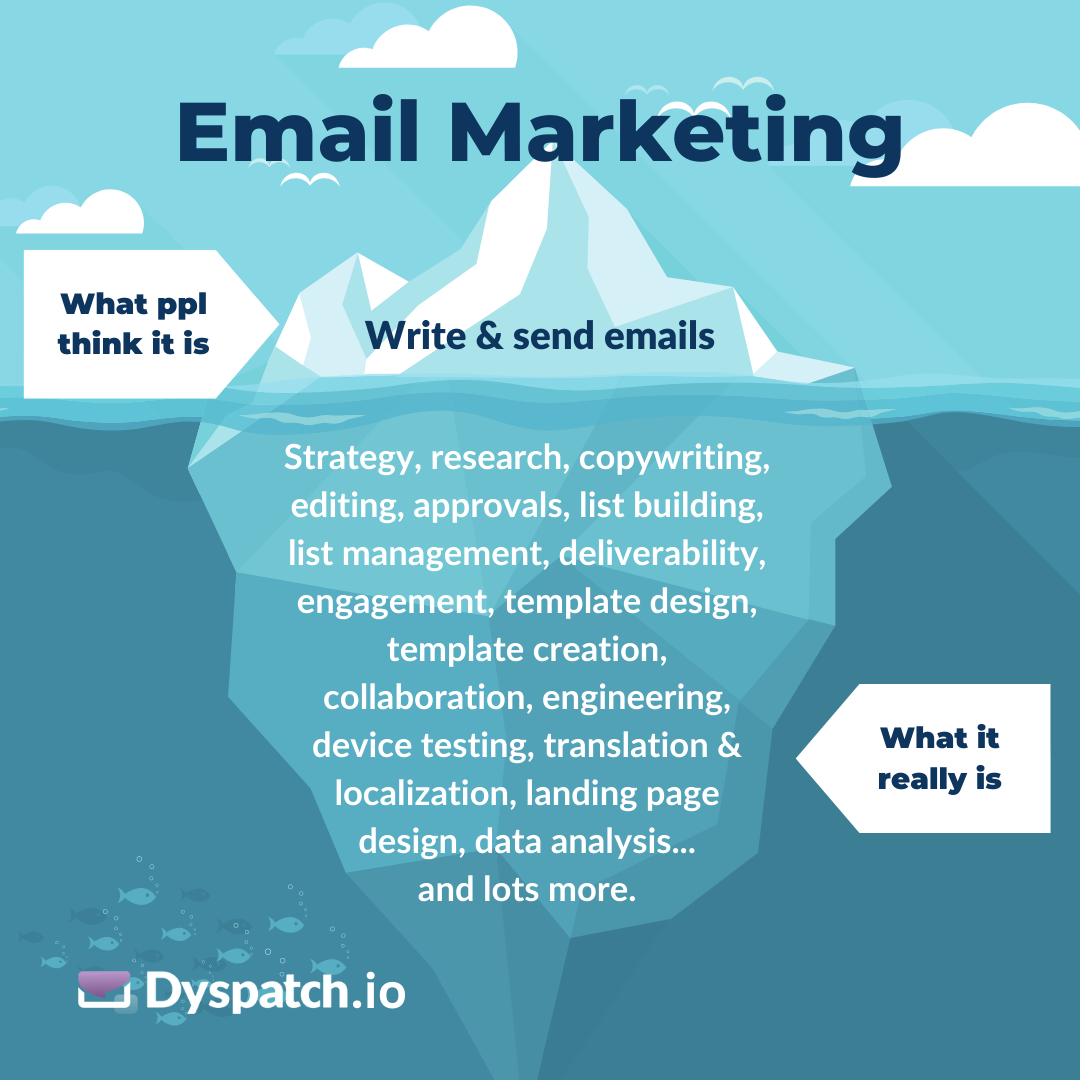
Ever hear someone say “email marketing is easy”? Show them this graphic. Most people see the tiny tip — writing...
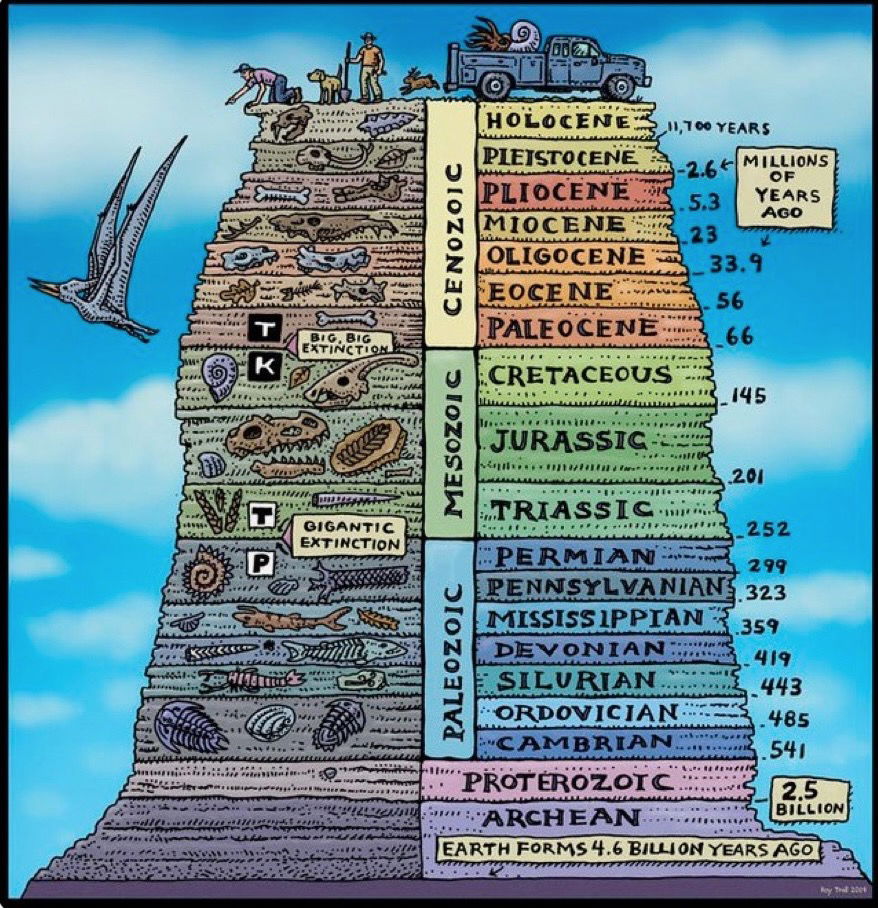
This chart by Rob Troll crams 4.6 billion years of Earth history into one colorful, scroll-stopping graphic. It’s not just...

This chart nails how relationships need different kinds of intimacy. Turns out, brands do too. If your marketing only focuses...

Ever wondered why perfumes have fancy names like “Eau de Toilette” or “Parfum”? This chart breaks it down: each term...


This bear survival graphic is a masterclass in message design. It’s visual, fast, and impossible to forget. In just two...
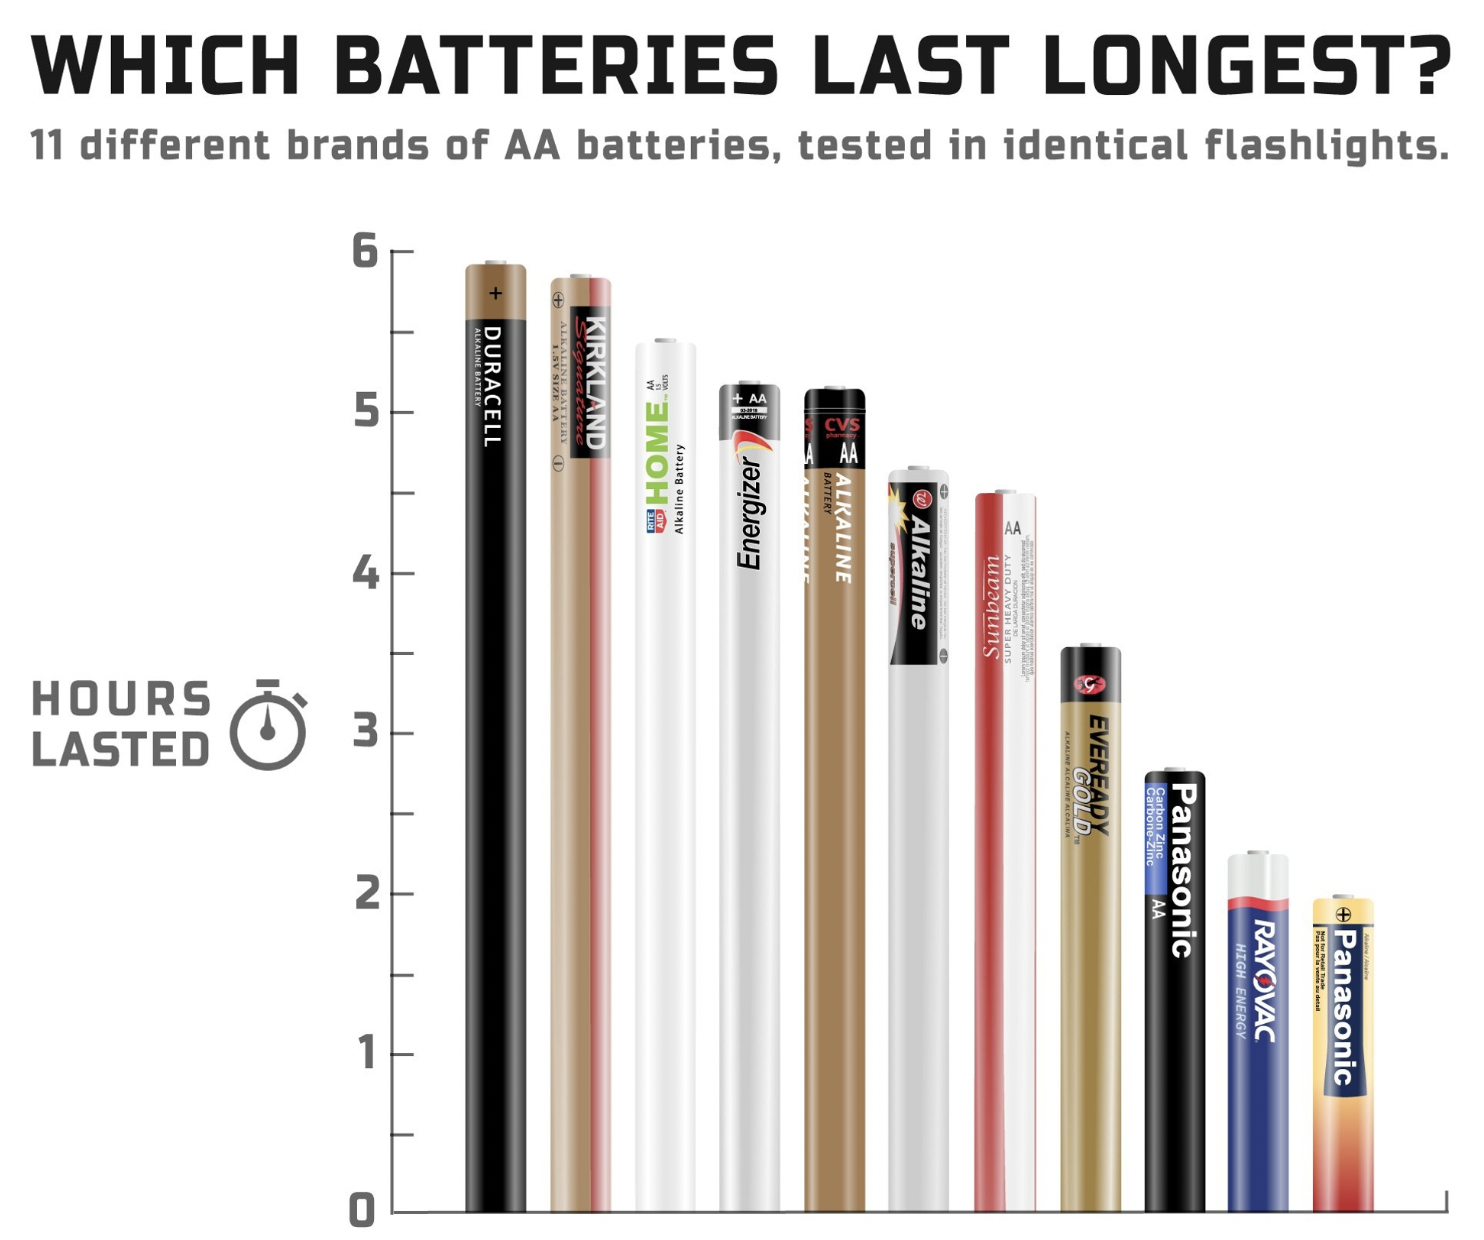
This “Battery Bar Chart” turns a dull stat graphic into something you instantly get. Instead of colored bars, it uses...

This vintage Felix the Cat ad nails attention-getting design. One huge smiling cartoon, one short pun headline, and everyone instantly...

This 1964 Western Electric ad doesn’t just sell phones—it sells progress. It walks you through almost 90 years of innovation...

This chart showing when humans “peak” at different skills is a fun reminder that not everything grows linearly—some things rise...
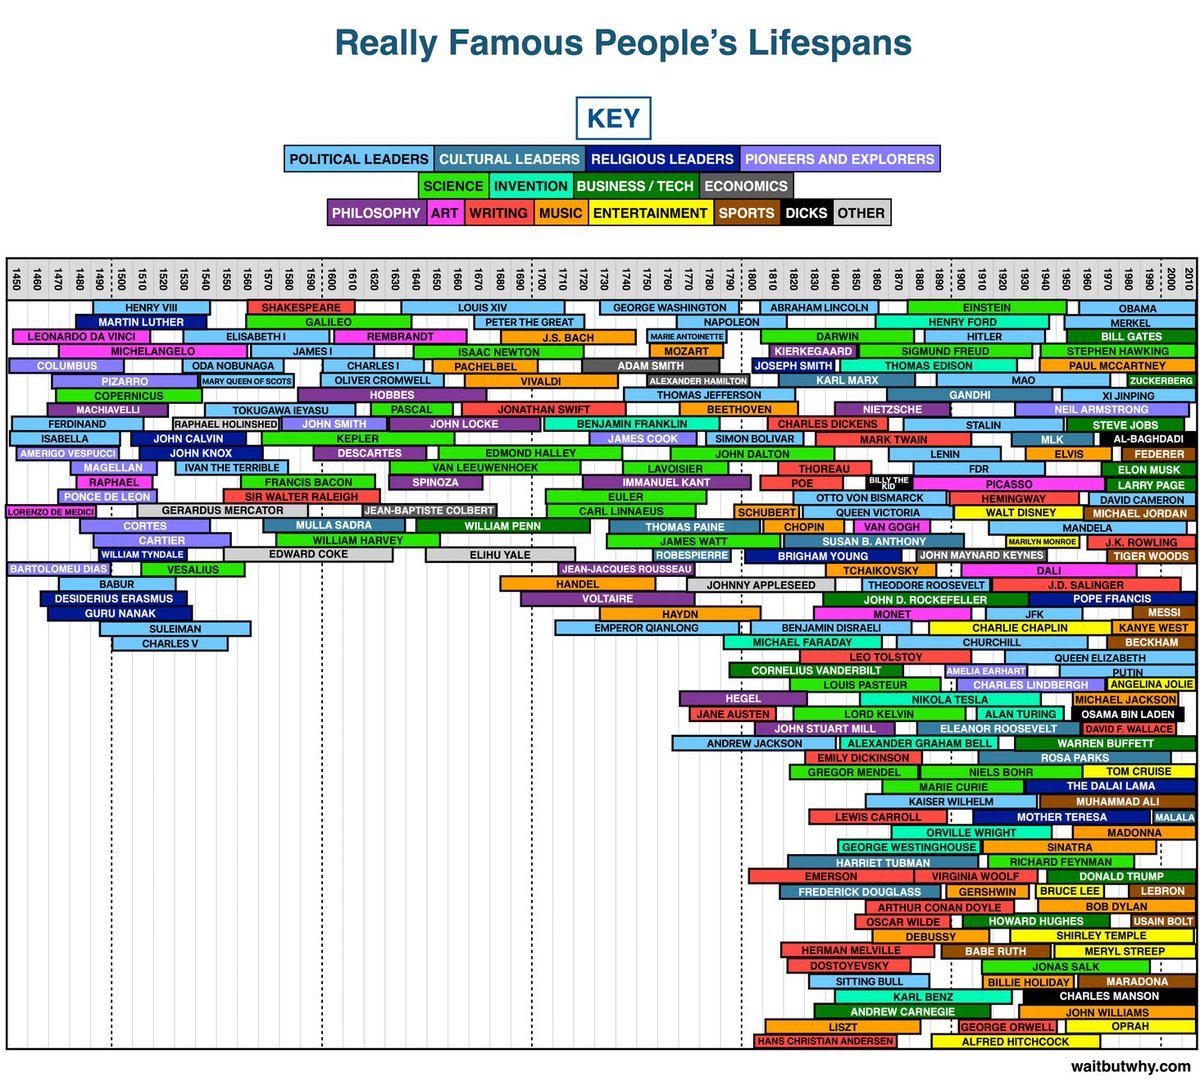
Look at this beauty: a massive block chart mapping famous people’s lifespans across history. It’s data visualization at its best...
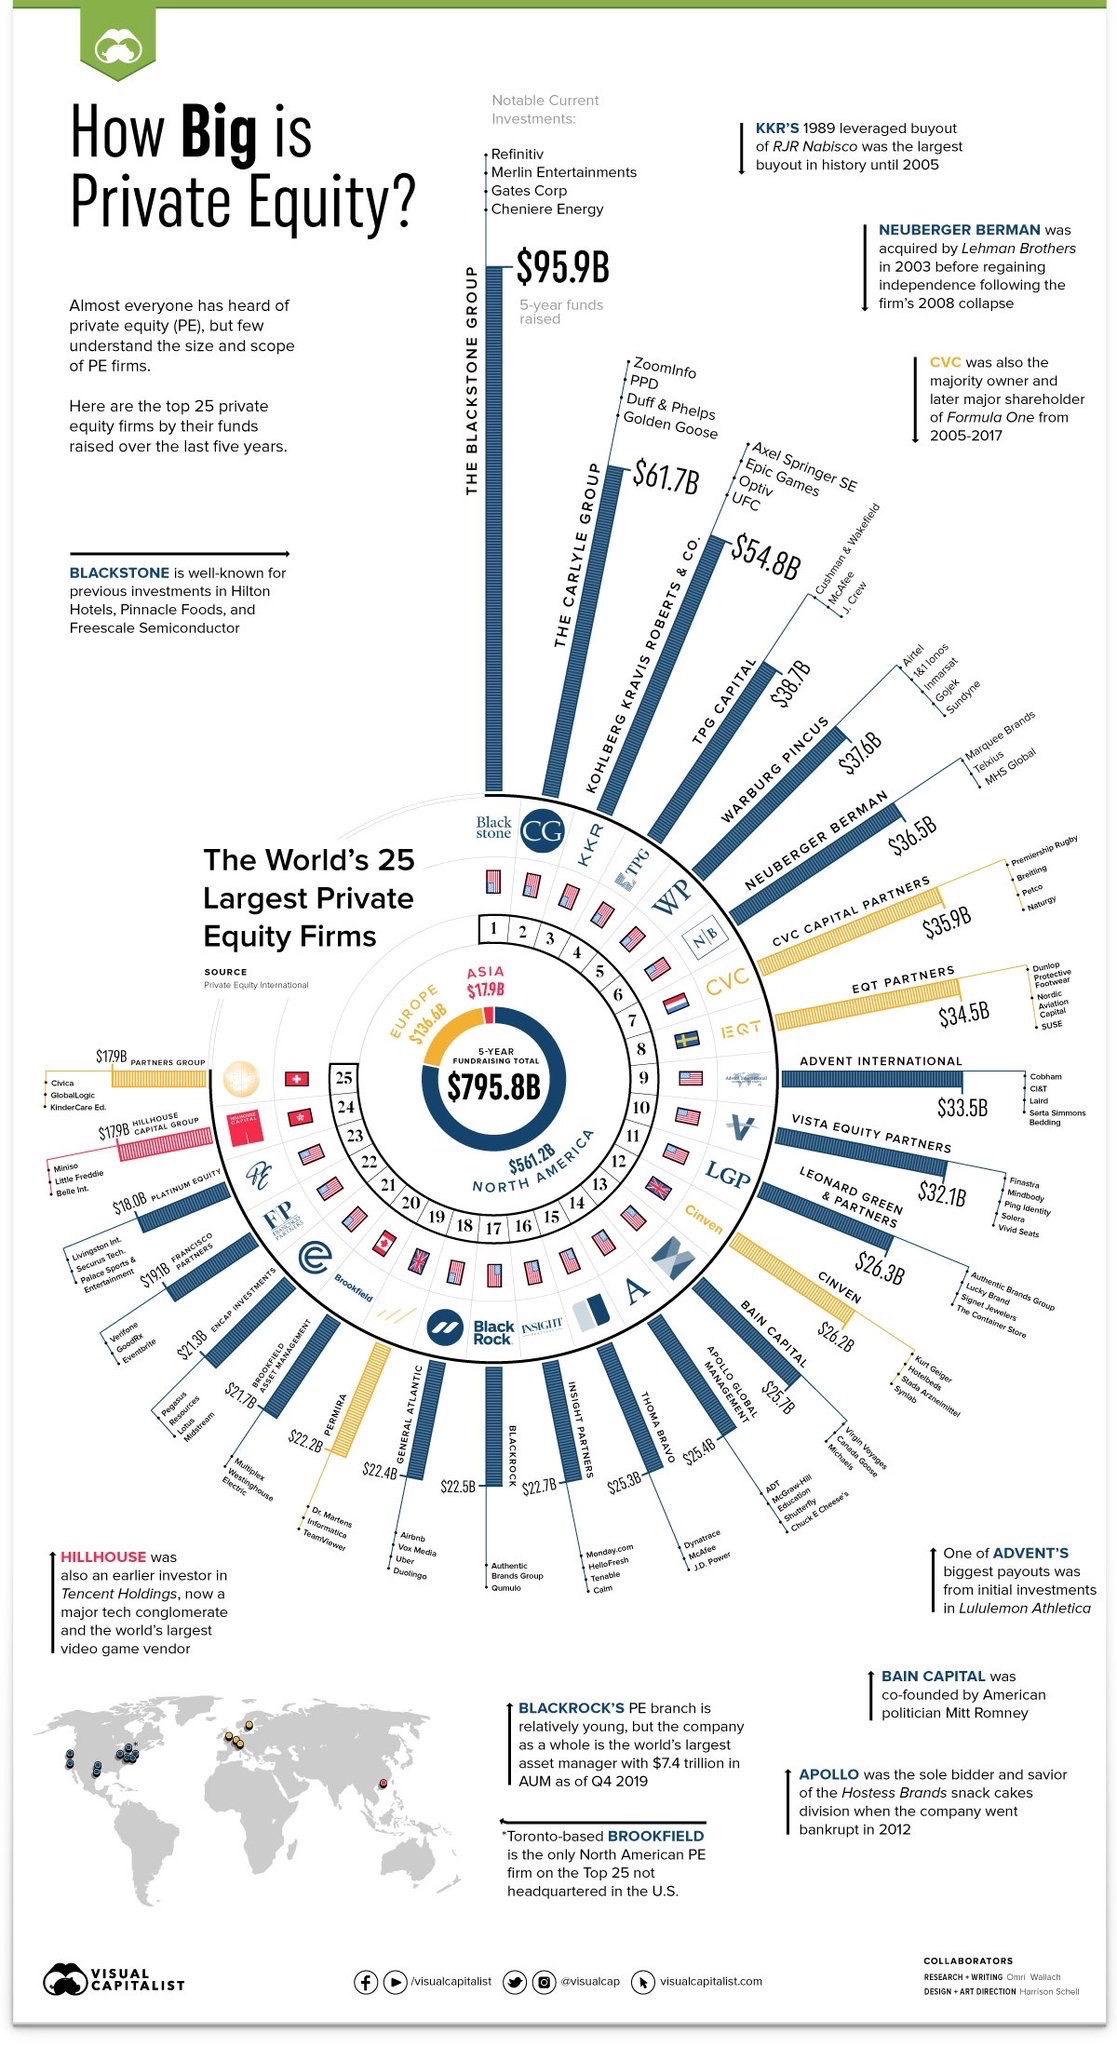
This chart by Visual Capitalist crushes the myth that all private equity firms are the same size. It maps out...

This chart comparing nuclear explosions doesn’t use boring bars or numbers. Instead, it shows mushroom clouds—each one bigger than the...
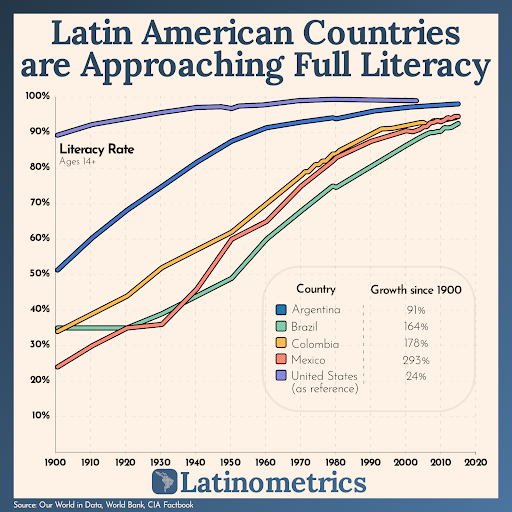
This chart from Latinometrics shows literacy rates in Latin America shooting past 90%. Day-to-day, the numbers don’t look explosive—but zoom...

This image nails it. You’re not selling a product. You’re selling transformation. Your customer is Mario, your product is the...

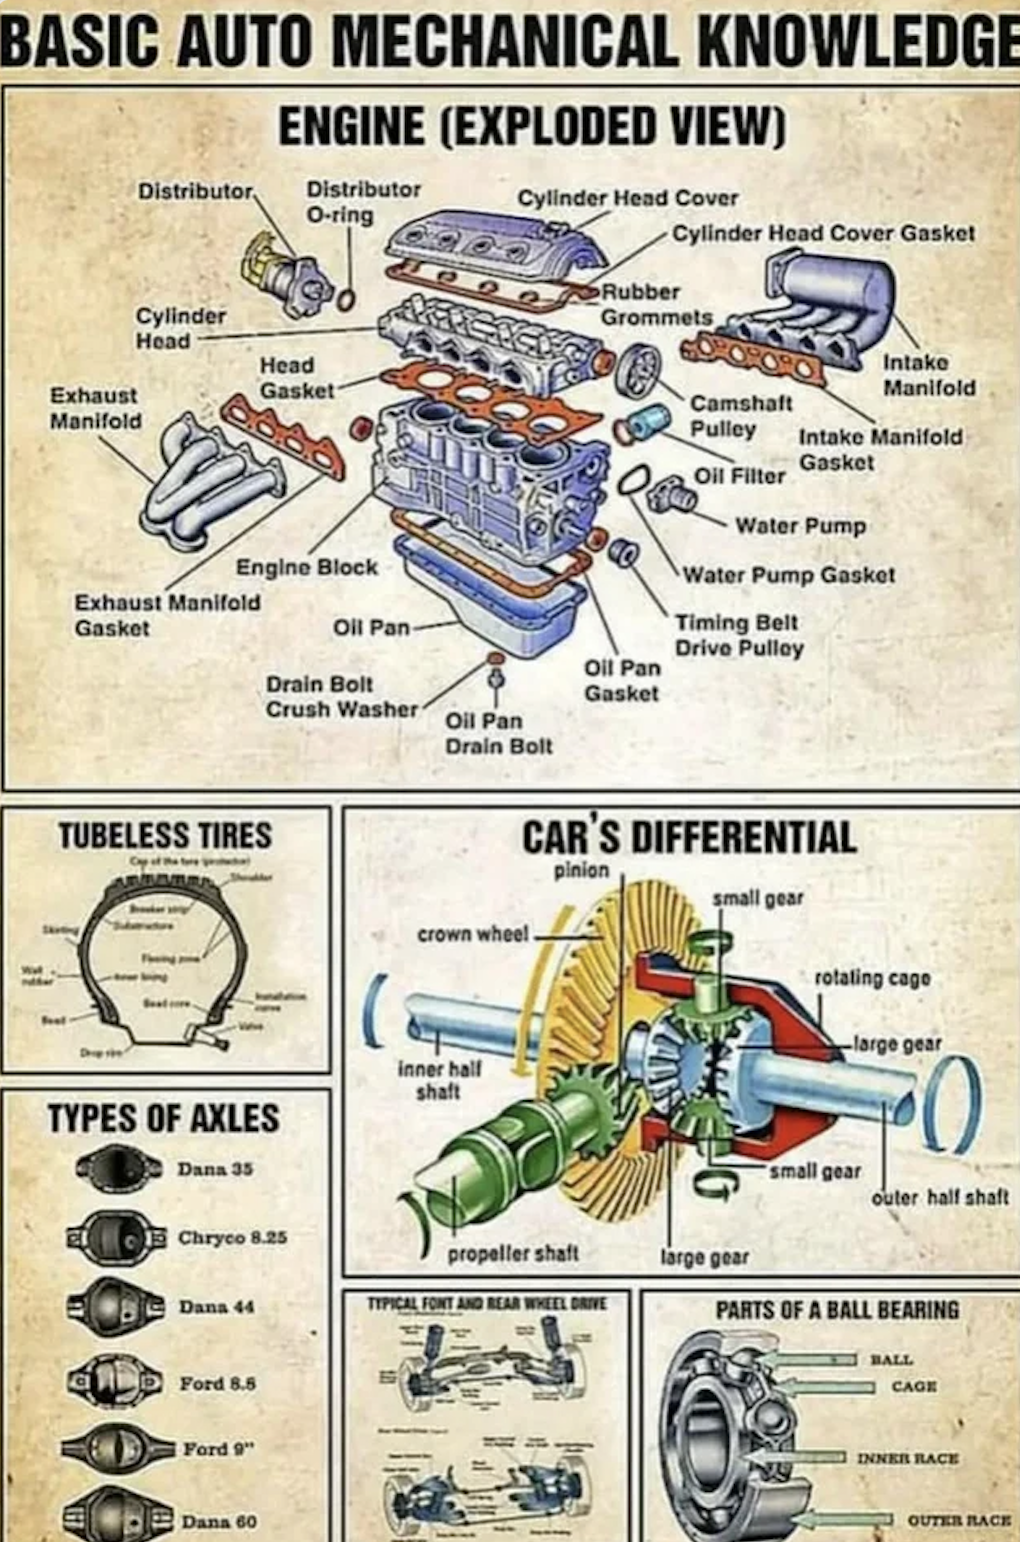
Before CAD tools, engineers built entire airplanes and engines using just pen and paper. This diagram of a car’s mechanics...

Ever wonder who really owns the brands you love? This chart shows how most “independent” car brands actually belong to...

This simple chart nails personal and professional growth: your Comfort Zone, Fear Zone, Learning Zone, and Growth Zone. It’s not...