
Car Industry Consolidation Chart
This cool visual chart shows which car companies own each car brand. Image Description The image is a detailed chart...

Type of Fragrances
Apparently different types of fragrances are determines by the percentage of perfume oil they contain, which correlates to how long...
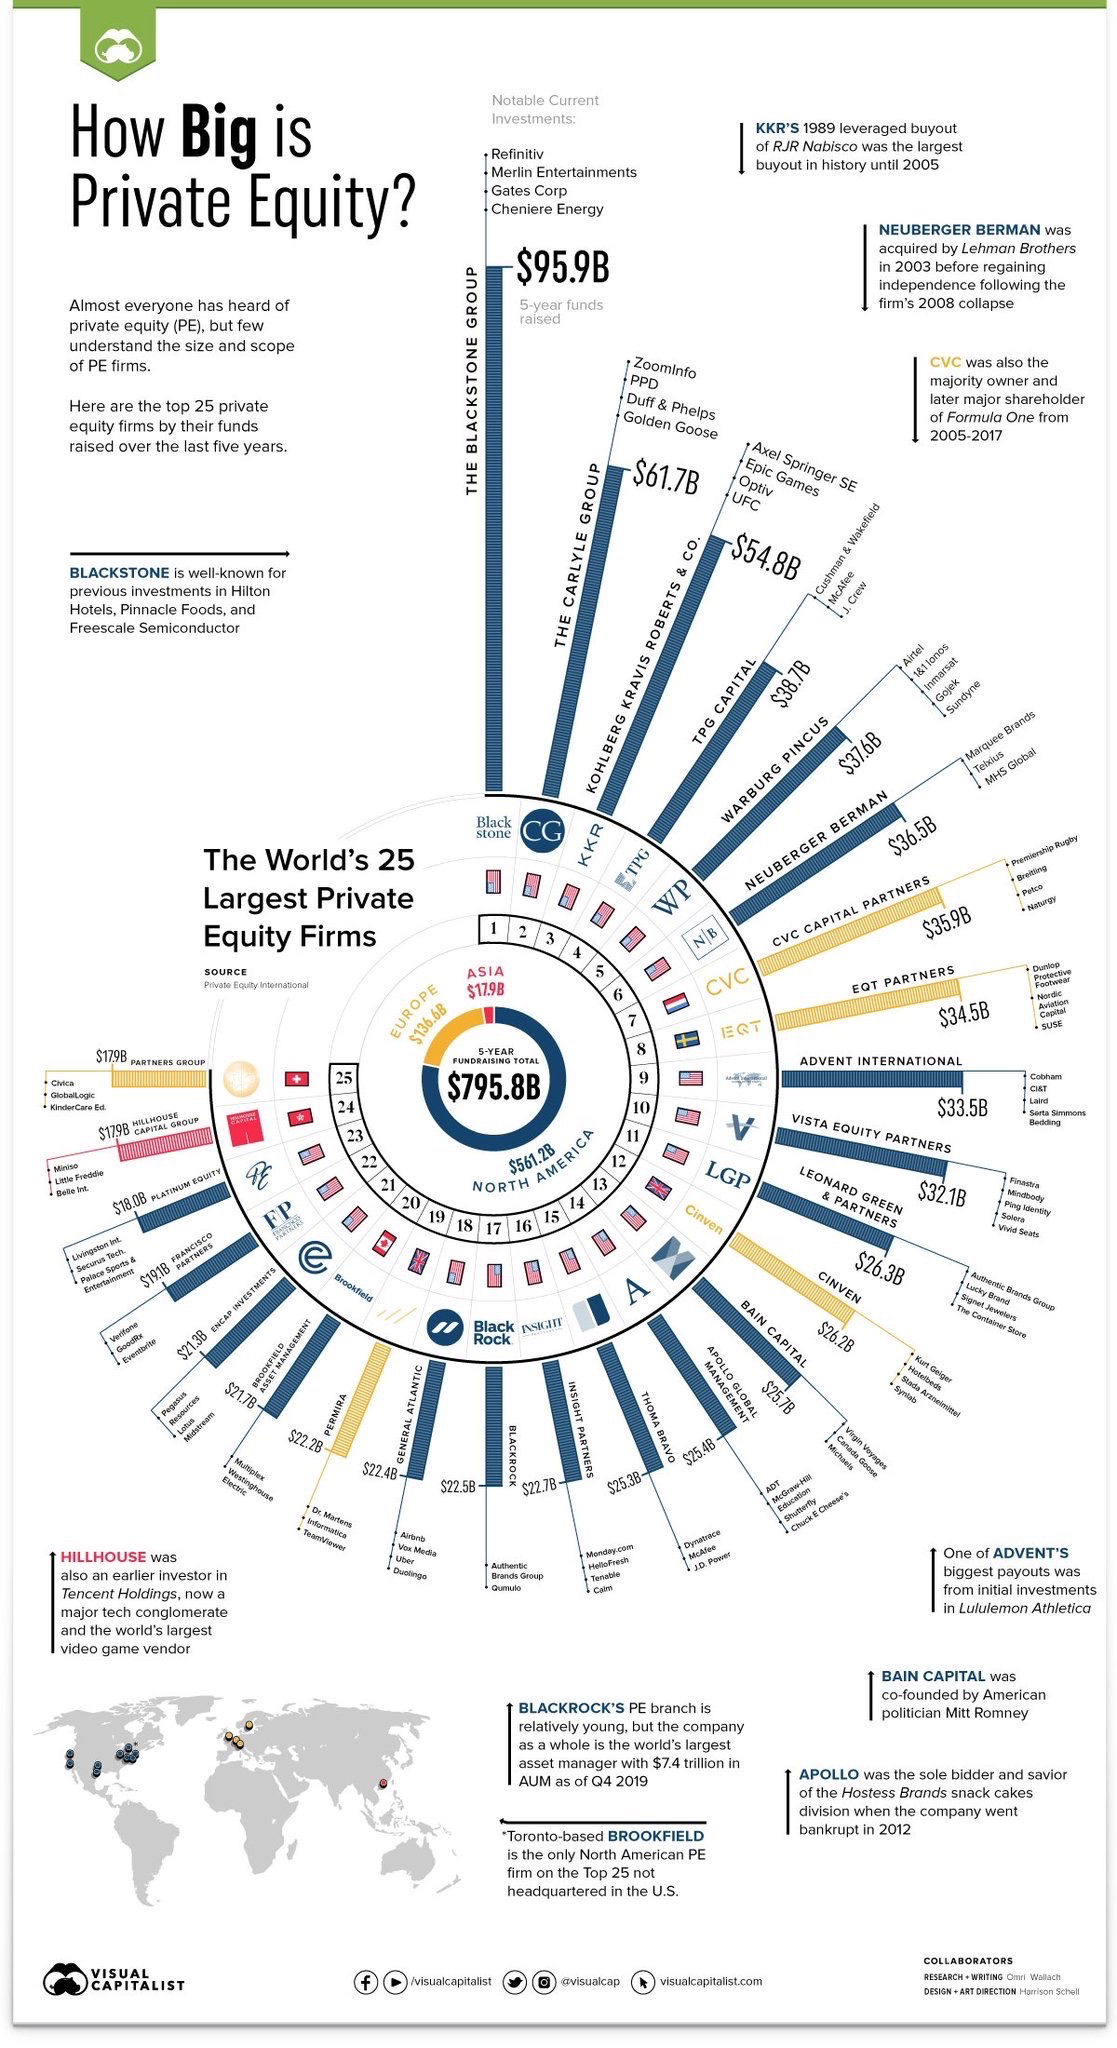
How Big Is Private Equity Chart
In one graphic this chart shows the different sizes of: Private equity firms Continents Countries Image Description The infographic illustrates...

Comfort Zone Circles
This cool circle chart shows the different areas of your Comfort Zone. Image Description The image is a circle chart...
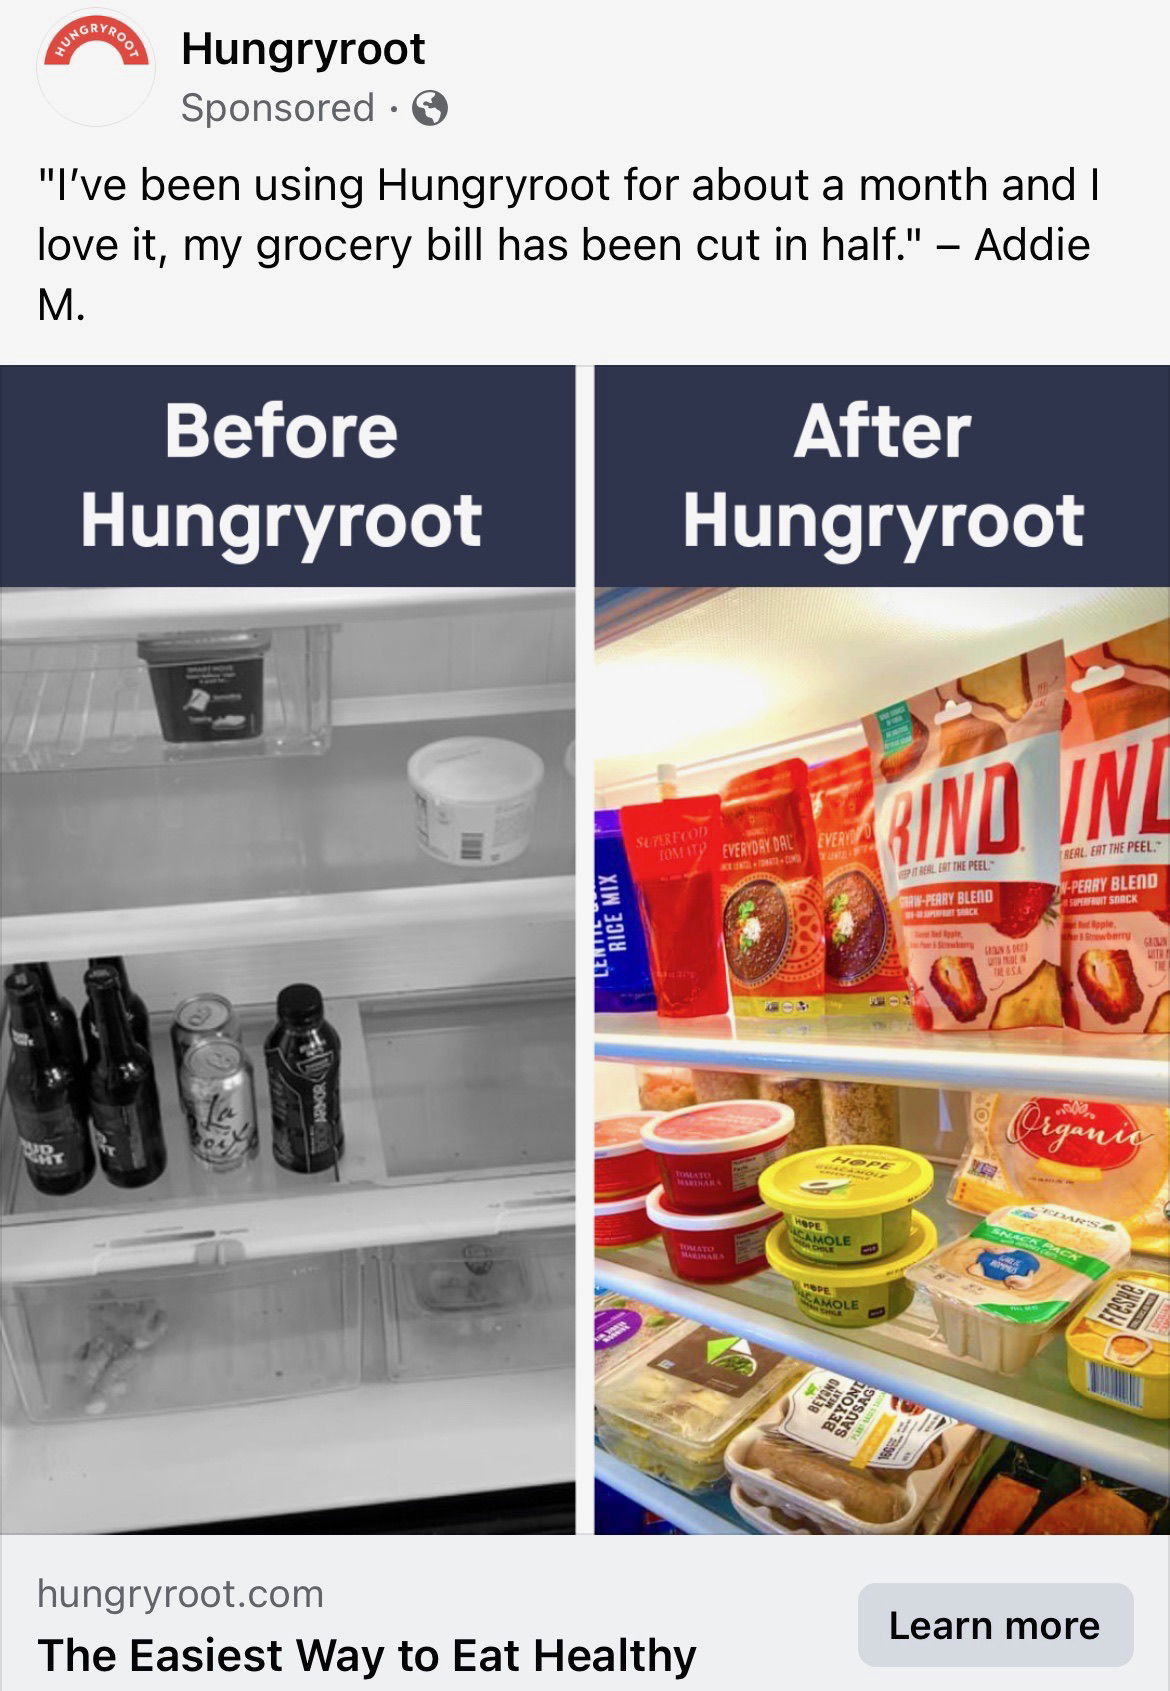
HungryRoot Before/After Ad
This is a cool before/after ad for food delivery service HungryRoot seen on Instagram and Facebook. The image shows it'll...
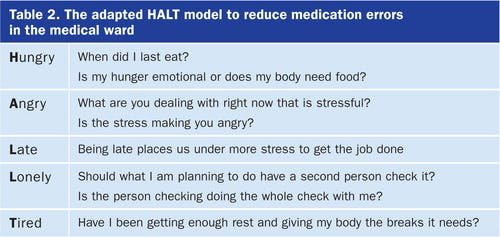
H.A.L.T. Acronym
I've always liked this acronym H.A.L.T. which means.... If you're not in a good mood, you're either: • Hungry •...

Dog Groomer Price Justification Chart
Every consultant or freelancer has had to justify their cost at times. This dog groomer was sick of people snarky...

Clixlo Price Comparison Ad
I like how Clixlo promotes their website builder by showing how many services (and their prices) you have to use...
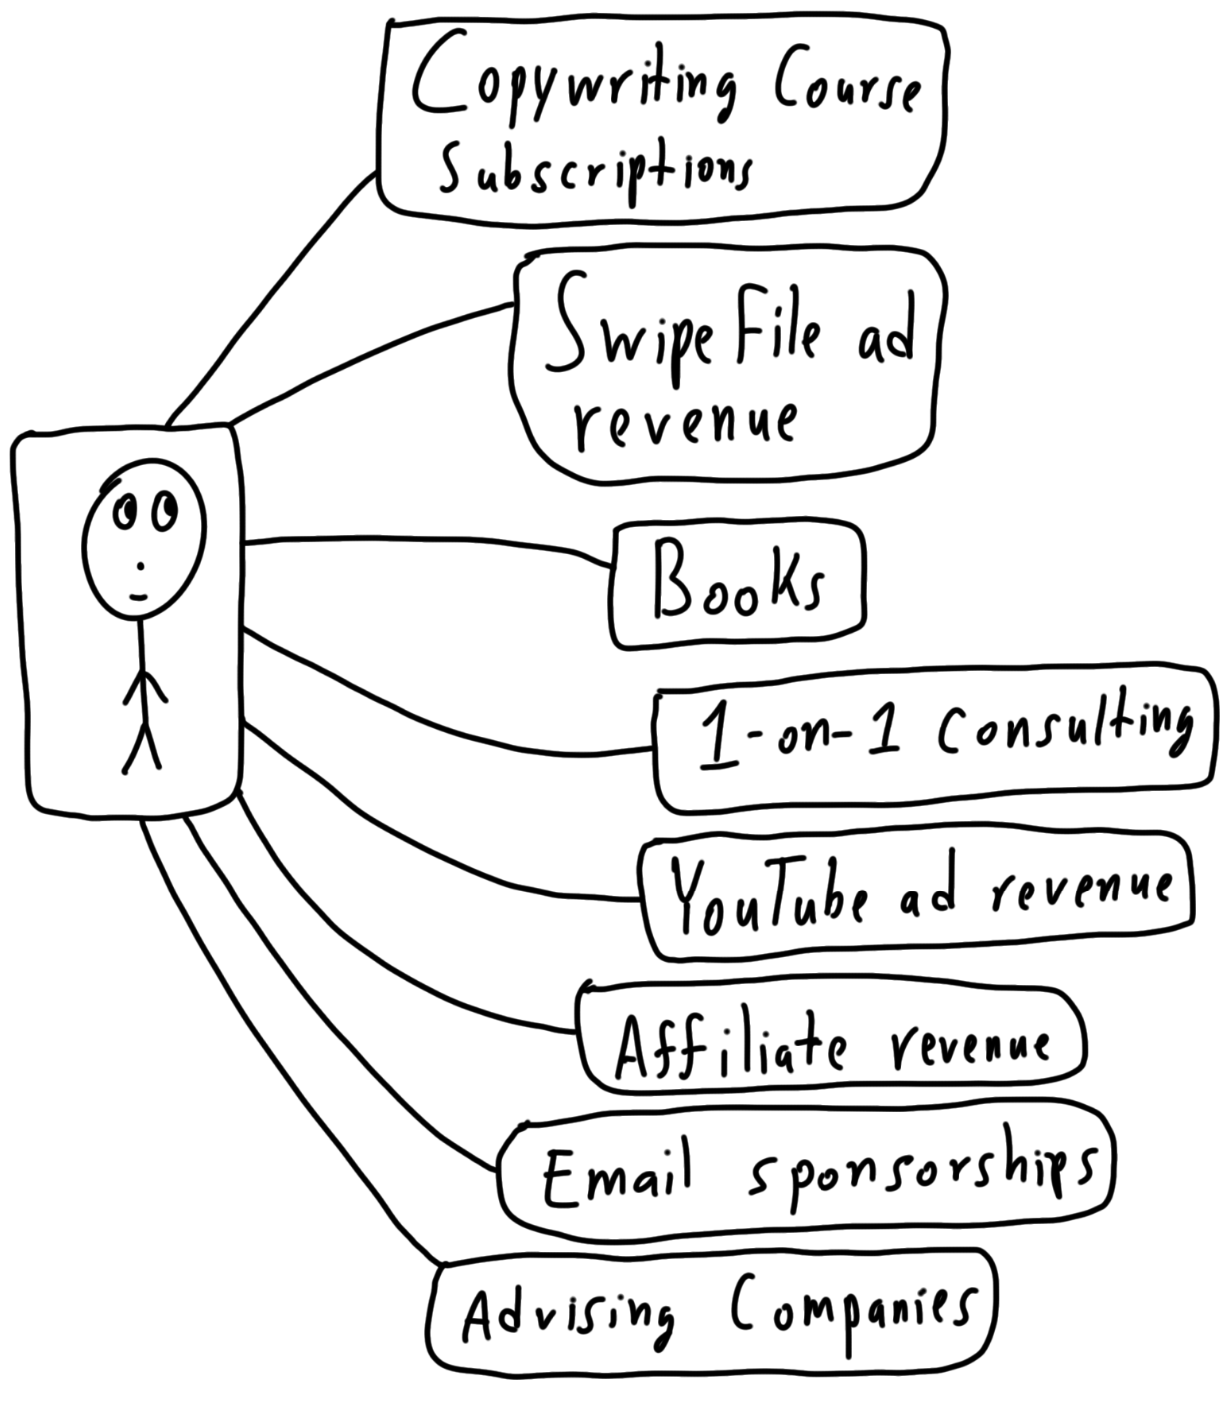
Copywriting Monetization Methods
Different potential income streams for a copywriter. Image Description A simple flowchart showing various income streams for a copywriter. It...

Characteristics of Pseudoscience Chart
This is a great little chart that outlines what might be "pseudoscience" and how to spot it. Image Description The...
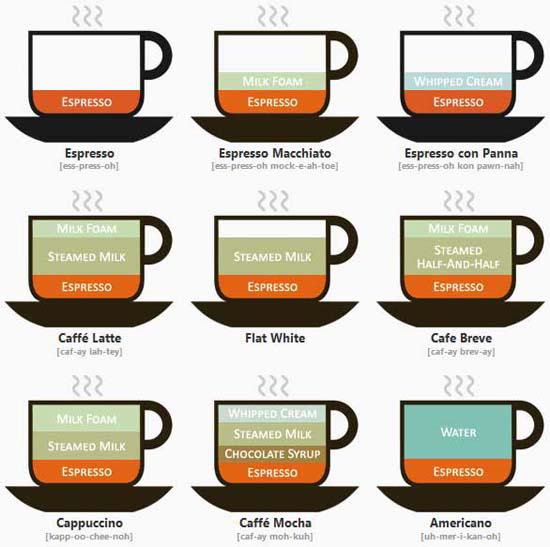
Coffee Ingredients Chart
This simple little image shows the differences between popular coffee drinks. Kind of interesting that almost every coffee drink is...

1958 Fender Amps Ad: LISTEN!
This is just an awesome ad in general because of the image. It also has some text explaining why Fender...
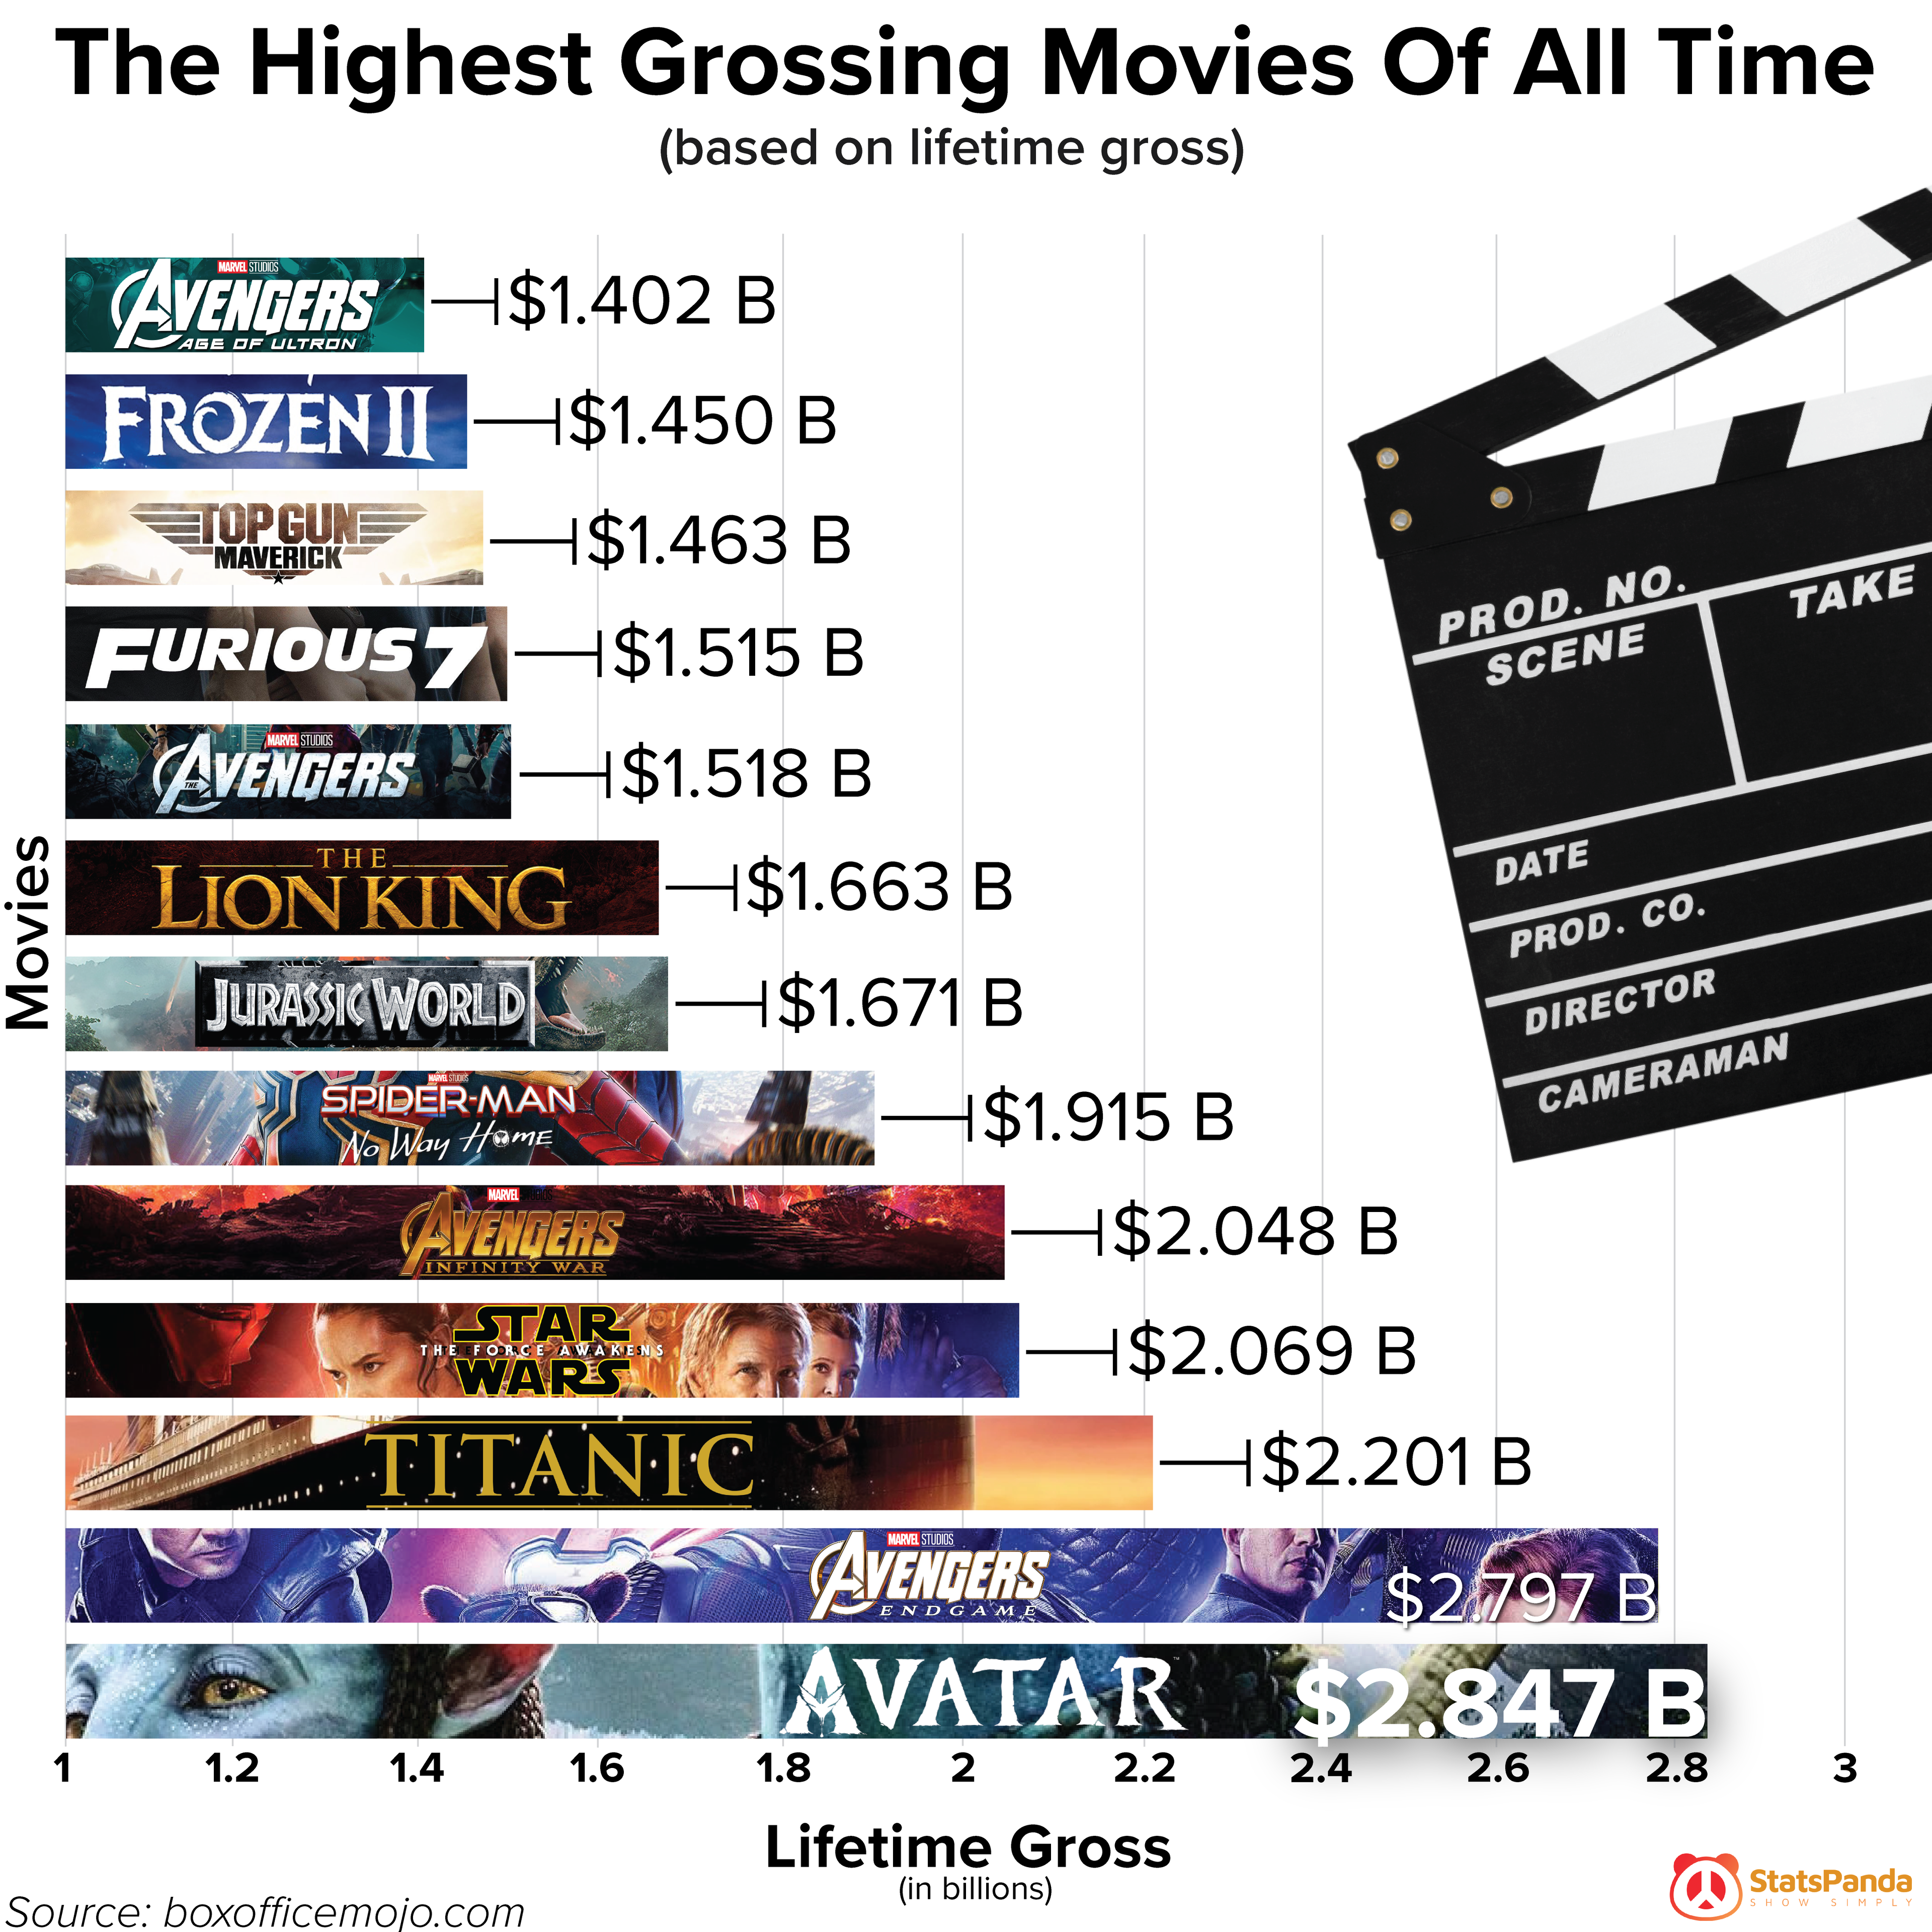
Highest Grossing Movie Data
This easy-to-understand chart form visually shows the highest grossing movie data. Image Description The image is a bar chart illustrating...

Explaining a Cardinals Outfit Diagram
I'm a huge fan of the TEXT + ARROWS diagram, and this diagram shows what the outfit of a Cardinal...

Cool Roman Field Force Diagram
This is a great diagram showing how a full Roman field force army would advance, and all the little details...

Protein Visualizations
These are some great protein visualizations from MeowMeix. Almost instantly you can compare proteins when laid out in this easy-to-understand...

Differences Between Chocolate Chart
I personally never know the differences between different types of chocolates.....until seeing this very easy chart! Image Description The image...

Re-working copy
Re-working the copy on a page is important from time to time. You may spot things your didn't like, or...
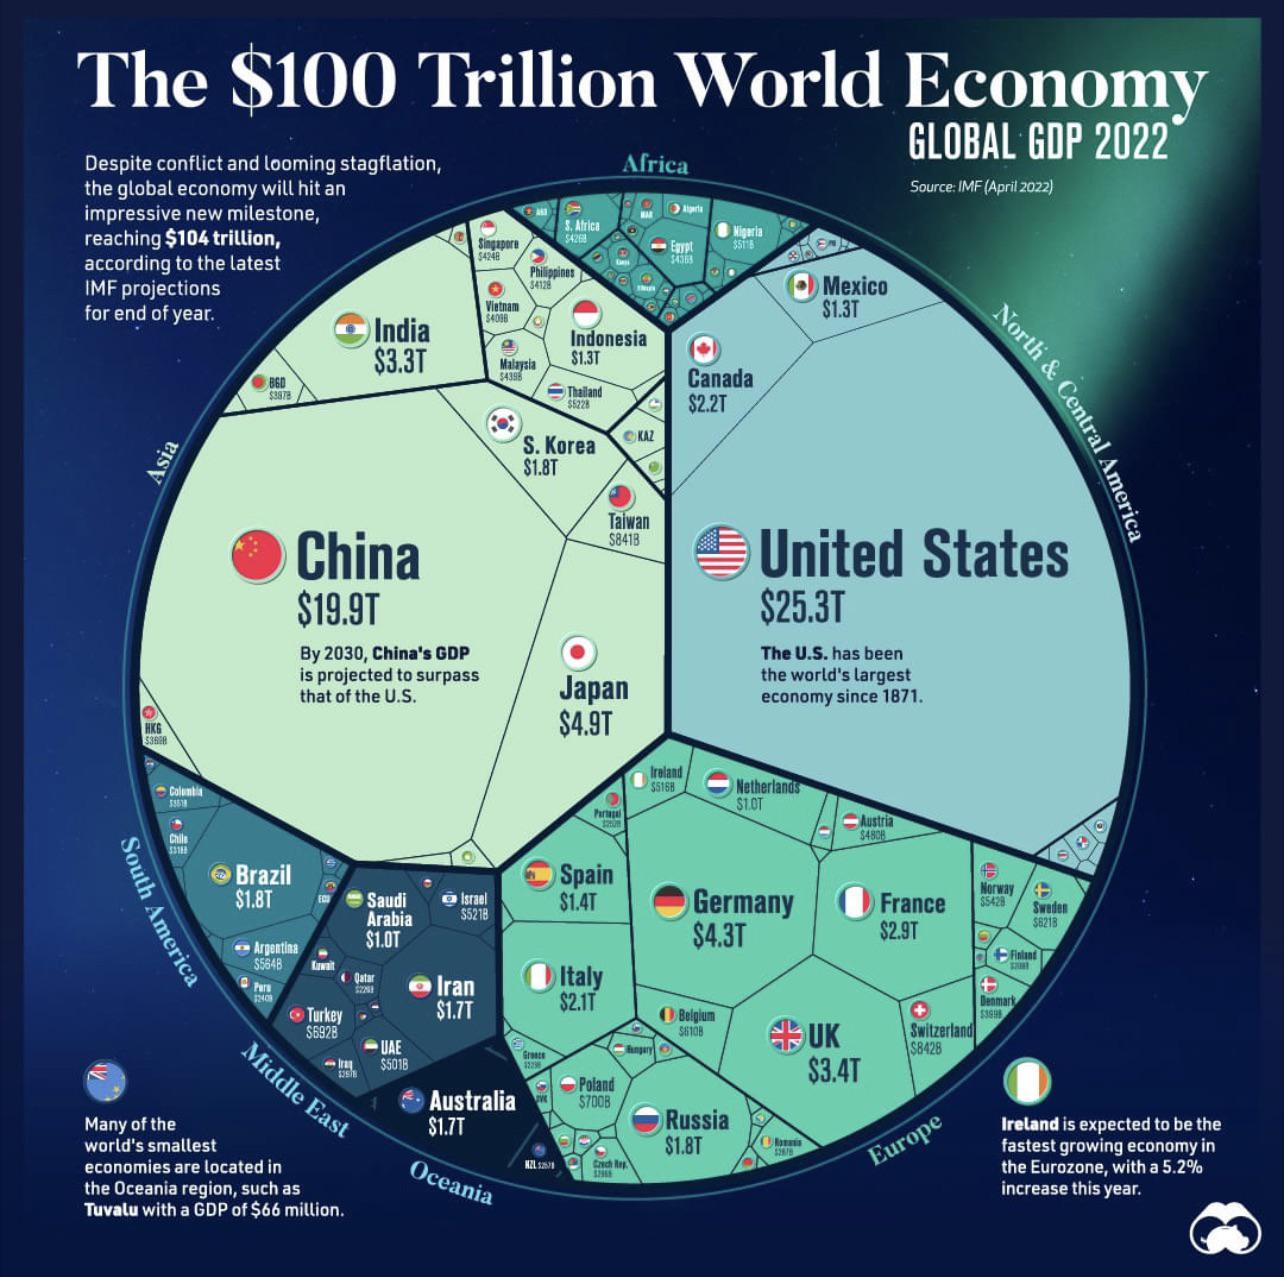
Visualization of the $100 trillion dollar world economy
Putting all this economic data in an easy to read chart with numbers represented by size is very a very...

Graphic showing what information you transmit to criminals
This is an interesting graphic using lines and text to demonstrate what information you are inadvertently communication via your car....

