1,913 Images and Illustration Examples That Teach Things
Drawings and illustrations and photography can transmit more information from human-to-human than text can. This board is perfect for designers and marketers seeking visual inspiration.
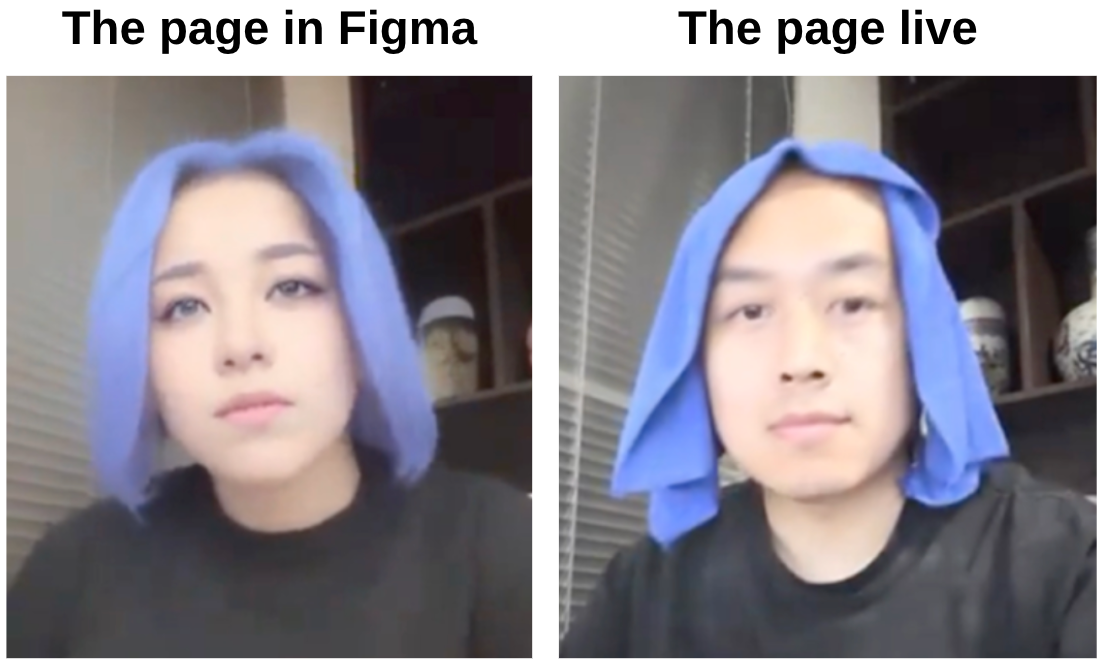
Figma to Production
Every designer knows this pain: your Figma mockup looks flawless… until you build it. Then suddenly, it’s the digital version...
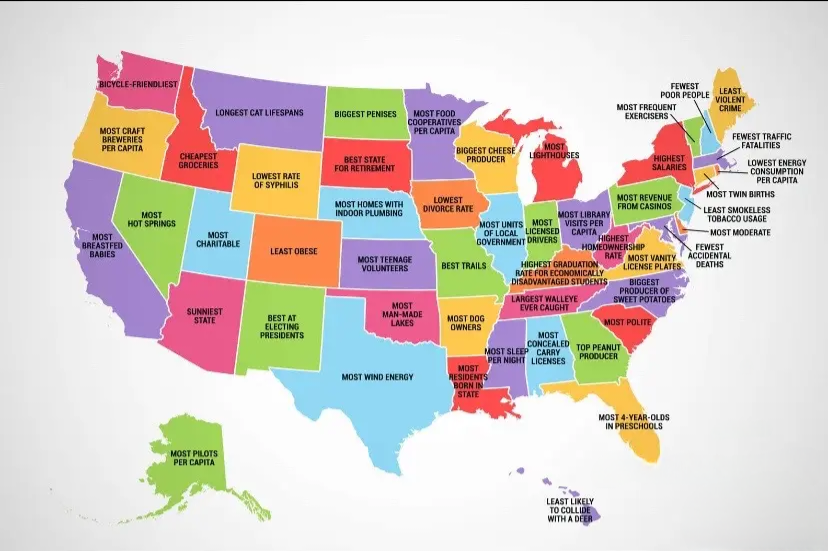
“The Most" of every United State
A colorful map showing what each U.S. state “has the most of” is the definition of viral content. It’s got...
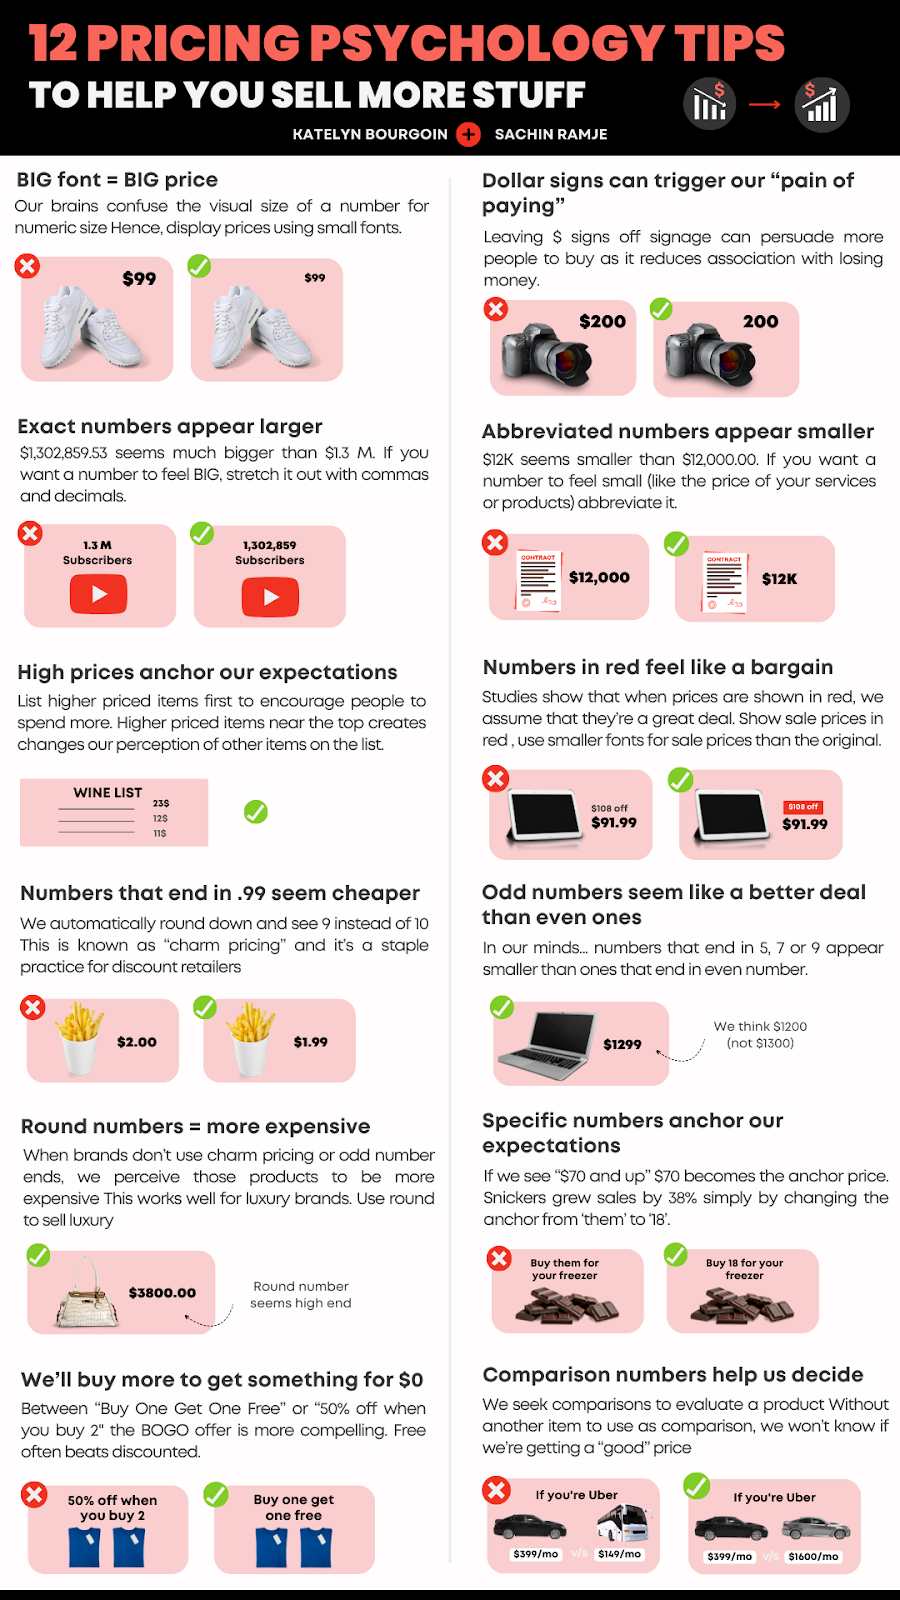
Pricing Psychology Tips
This graphic by Katelyn Bourgoin is like a mini-MBA in pricing. It shows how tiny visual tweaks can make the...

Michael Cera + CeraVe Advertising Campaign
CeraVe pulled off a marketing masterclass by leaning into internet chaos. When random Reddit threads joked that Michael Cera founded...
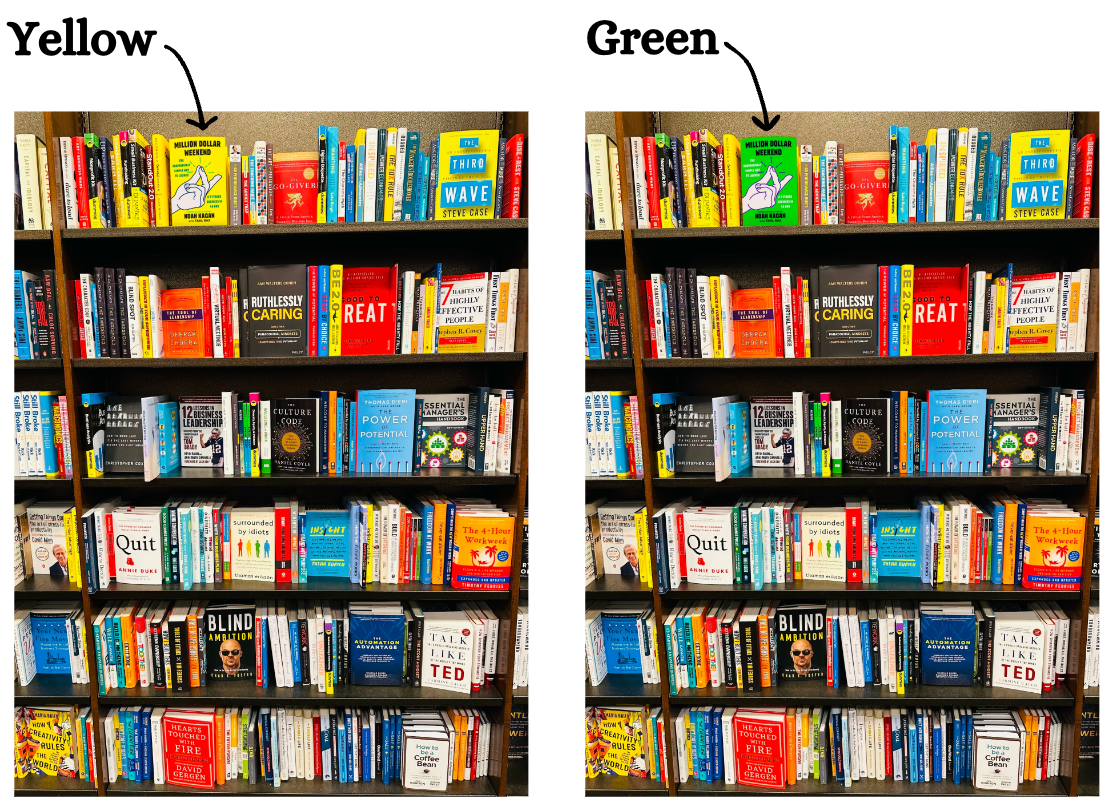
Book Split Testing: Noah Kagan’s Million Dollar Weekend
Noah Kagan didn’t guess his book cover design. He tested it. He literally photoshopped mockups of his book Million Dollar...
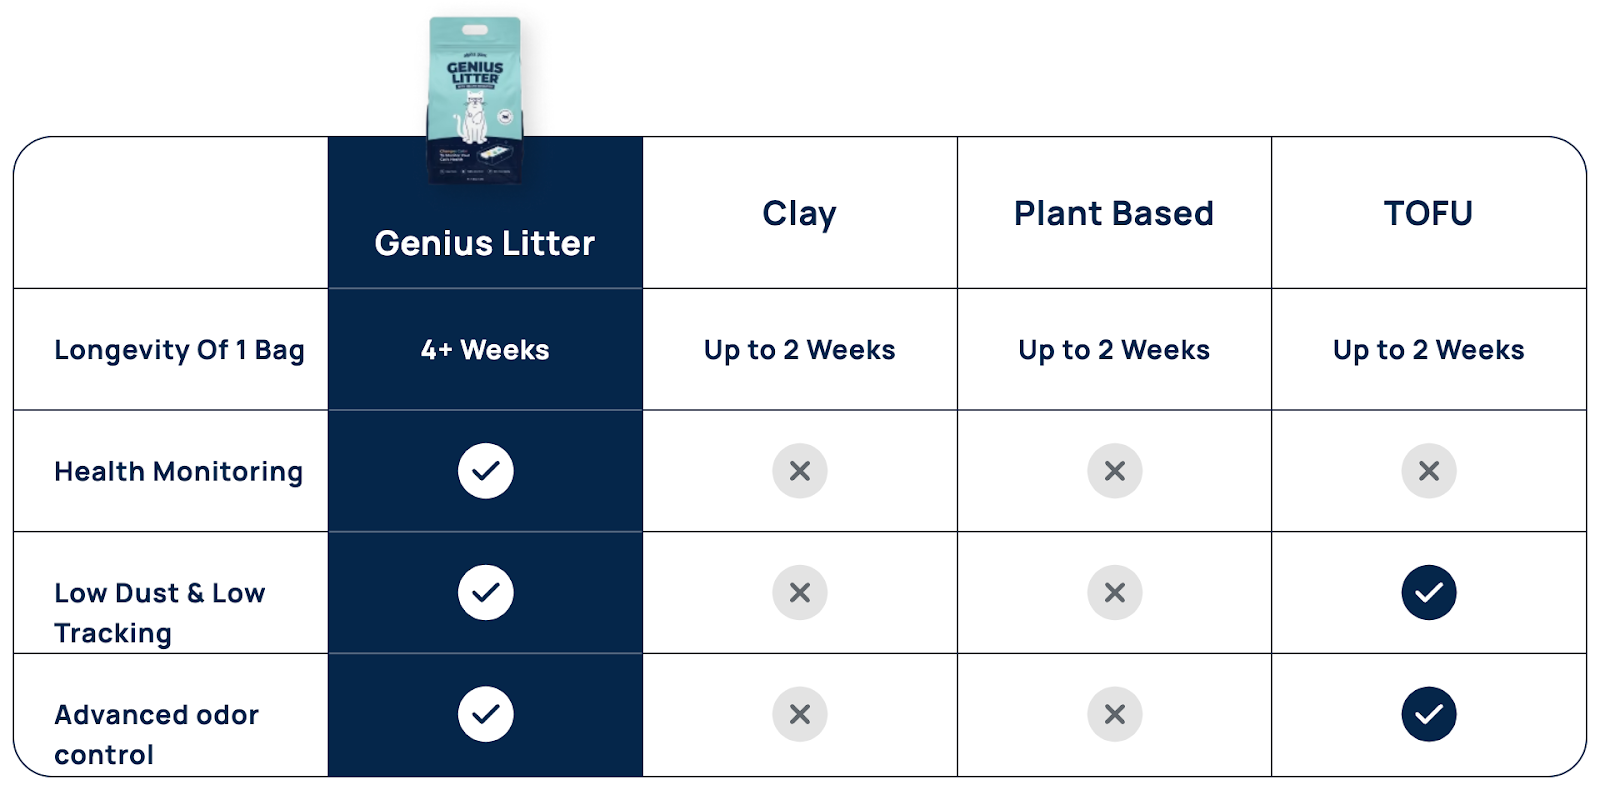
Genius Litter Comparison Chart
Sometimes words aren’t your best sales tool—charts are. Genius Litter nails this by comparing their cat litter against others in...

Zoom Etiquette Chart
What people think is “rude” on Zoom says a lot about how audiences judge brands too. This Chartr survey shows...

Commercial Airline Cruising Speed (1930-2020)
This chart shows airline speeds jumped fast from 1930 to 1970… then flatlined around 500 mph for 45+ years. Once...

1928 San Bernardino, California locomotive factory
Old factories like this one ooze with the smell of sweat, steel, and success. Rows of steam engines being built...
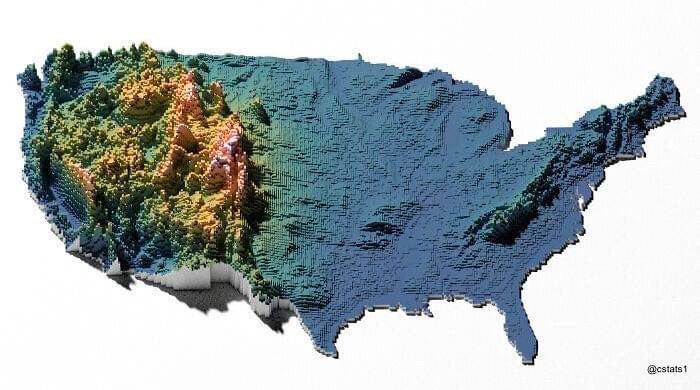
US Mountain Data Map
Most maps of the U.S. look flat and boring. But this 3D topographical map? It instantly shows you who’s got...

King of the Hill Visual Style Guide:
Ever notice how King of the Hill doesn’t feel like a cartoon? It feels like you’re eavesdropping on real people...
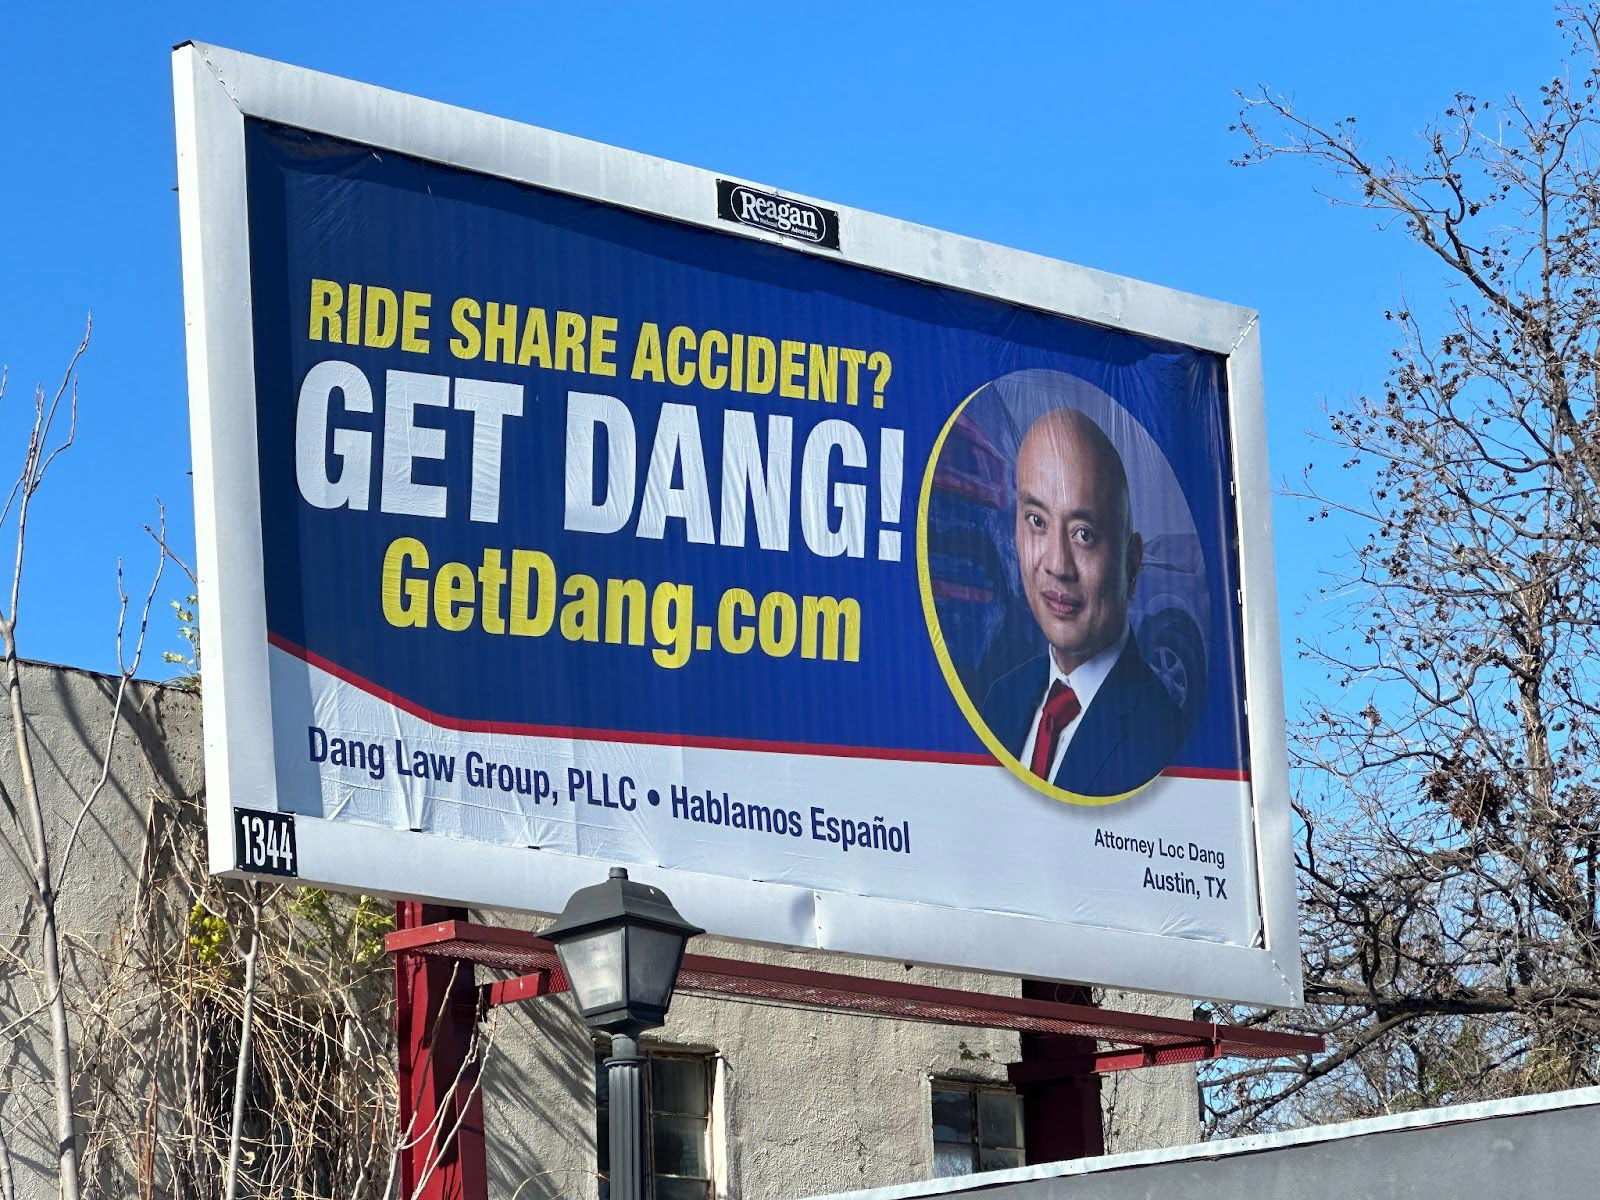
Get Dang Billboard
This billboard nails it. Attorney Loc Dang turned his already-memorable last name into a killer brand hook: “Get Dang!” It’s...

One image, the bartending skill encapsulated.
This image looks like a set of engineering schematics, but it’s actually drink recipes. Each cocktail is laid out with...
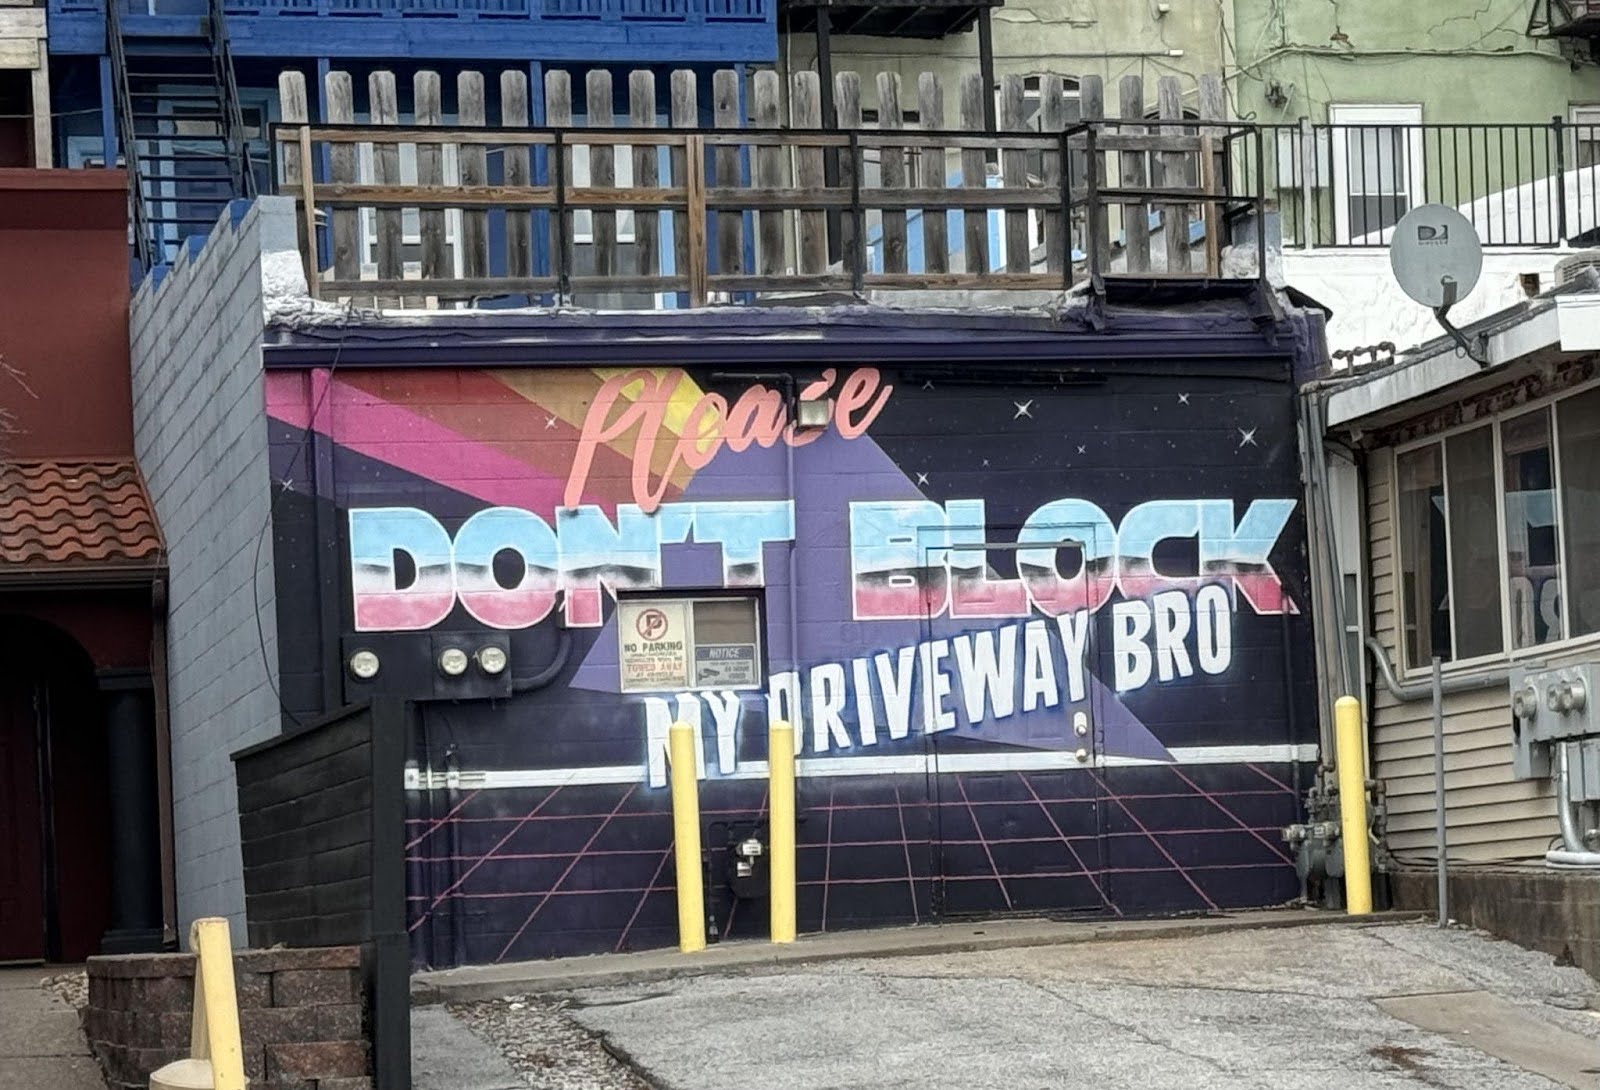
Art + Driveway Sign
This driveway owner could’ve slapped up a cheap “No Parking” sign. Instead, they went full 80s neon mural: “Please DON’T...
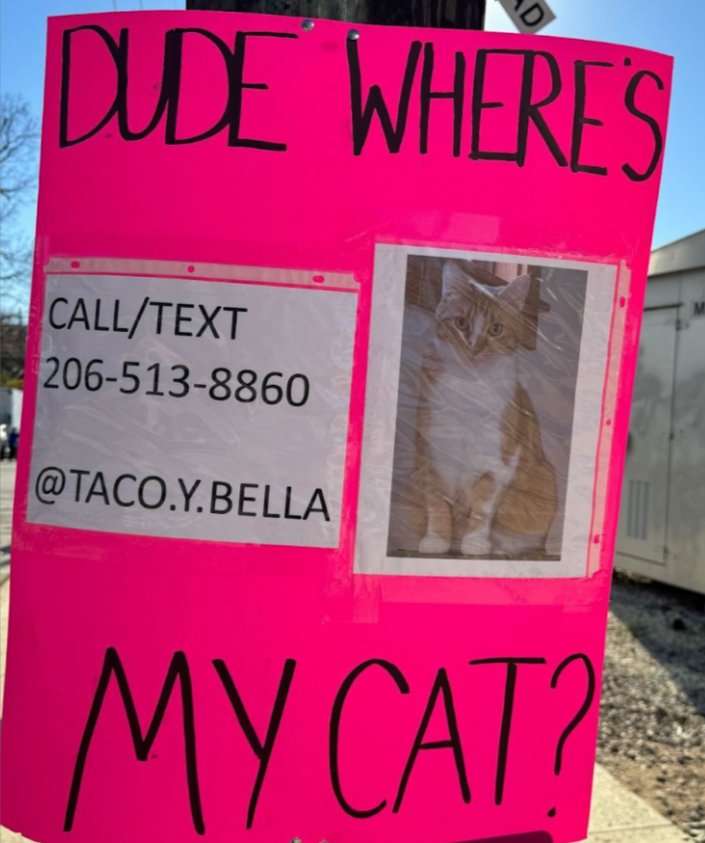
Copywriting in real life for cat poster
This neon pink poster grabs your eyeballs instantly. Instead of the boring “Lost Cat,” it proudly screams “Dude Where’s My...
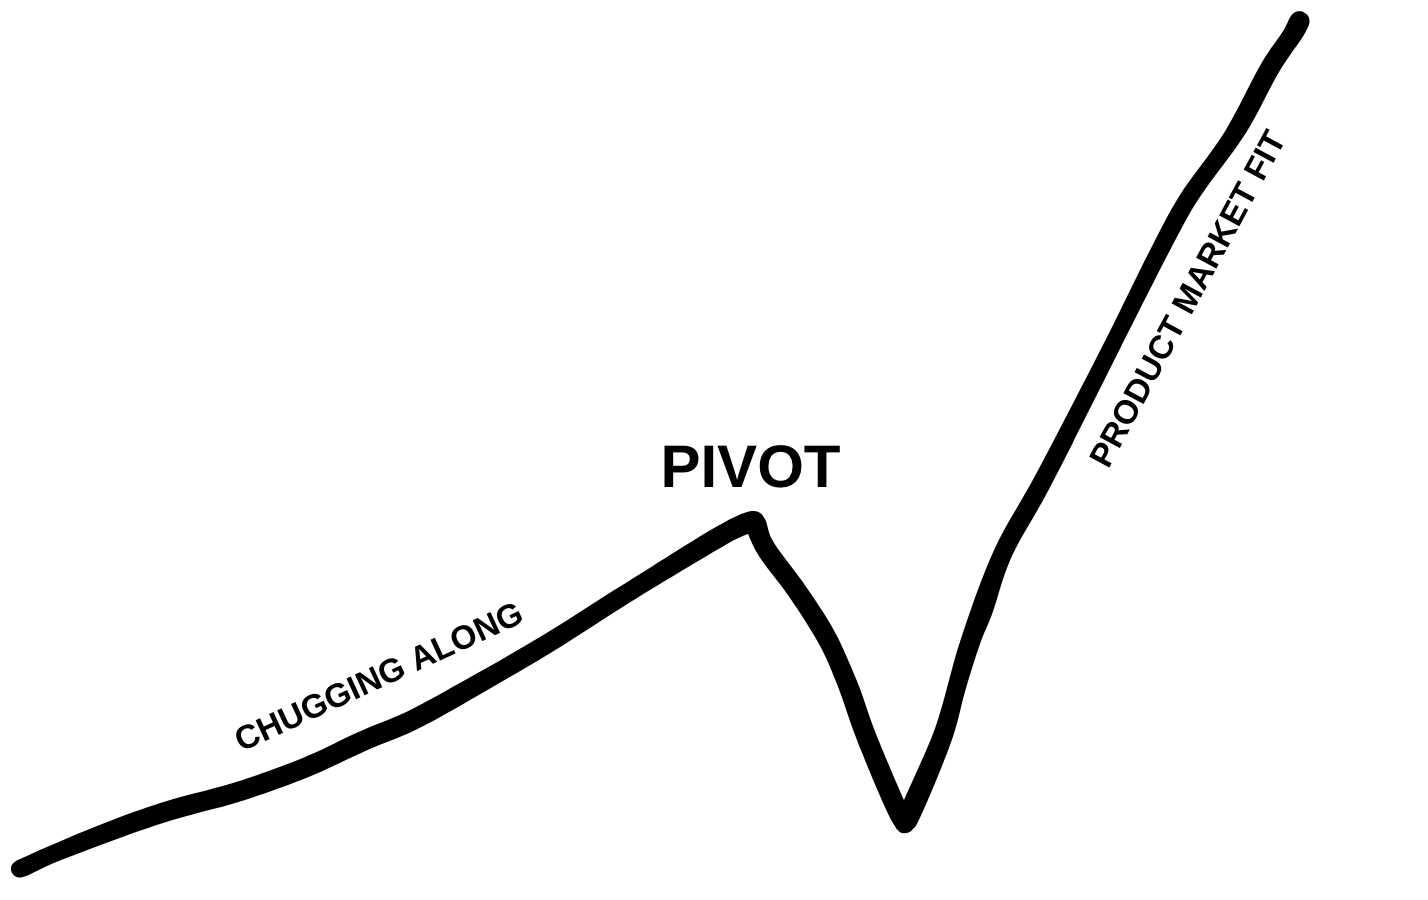
It’s not a “pivot” if you don’t lose a bunch of customers.
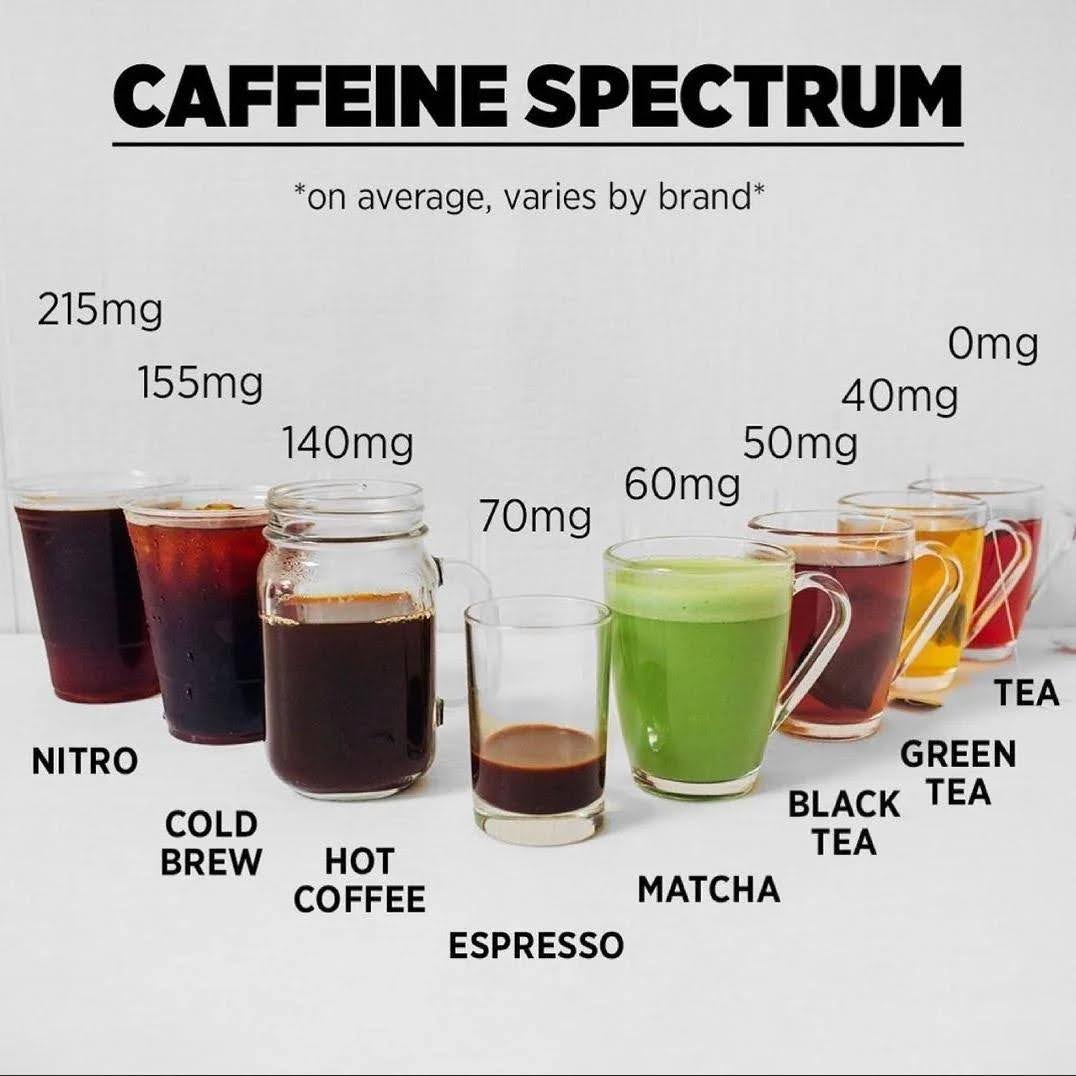
Caffeine Spectrum Data
This caffeine chart nails it. Instead of dumping numbers into a table, it shows drinks side by side so you...
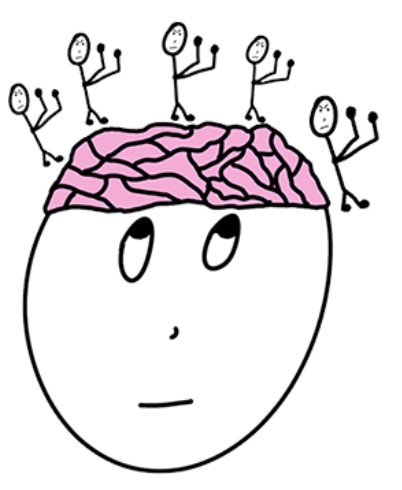
Guard your brain when writing.
You know that feeling when you sit down to “get work done”… and 10 minutes later you’re scrolling Instagram? These...
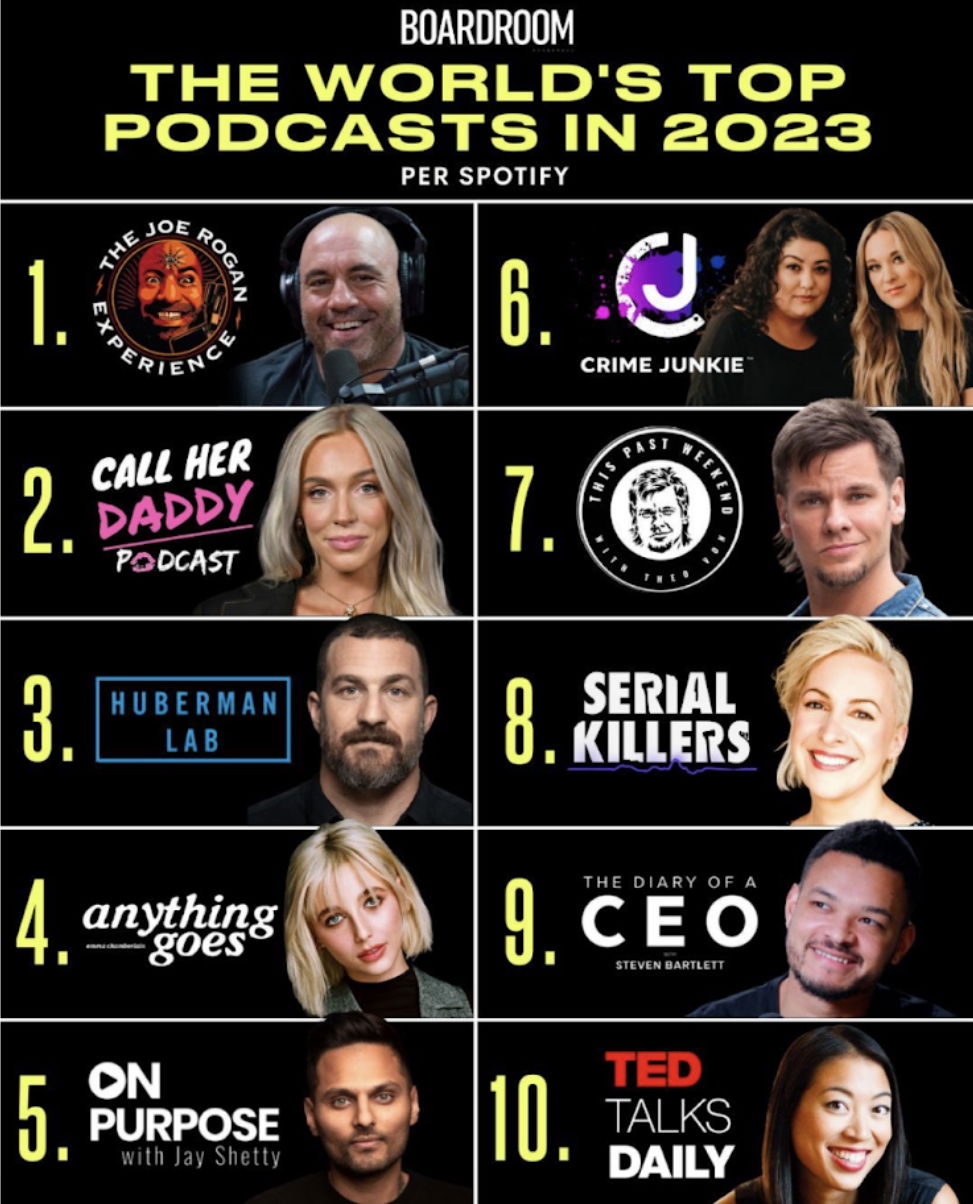
The world’s top Podcasts in 2023
Every top podcast in 2023 has one thing in common: a strong personal brand behind it. Rogan, Alex Cooper, Huberman,...
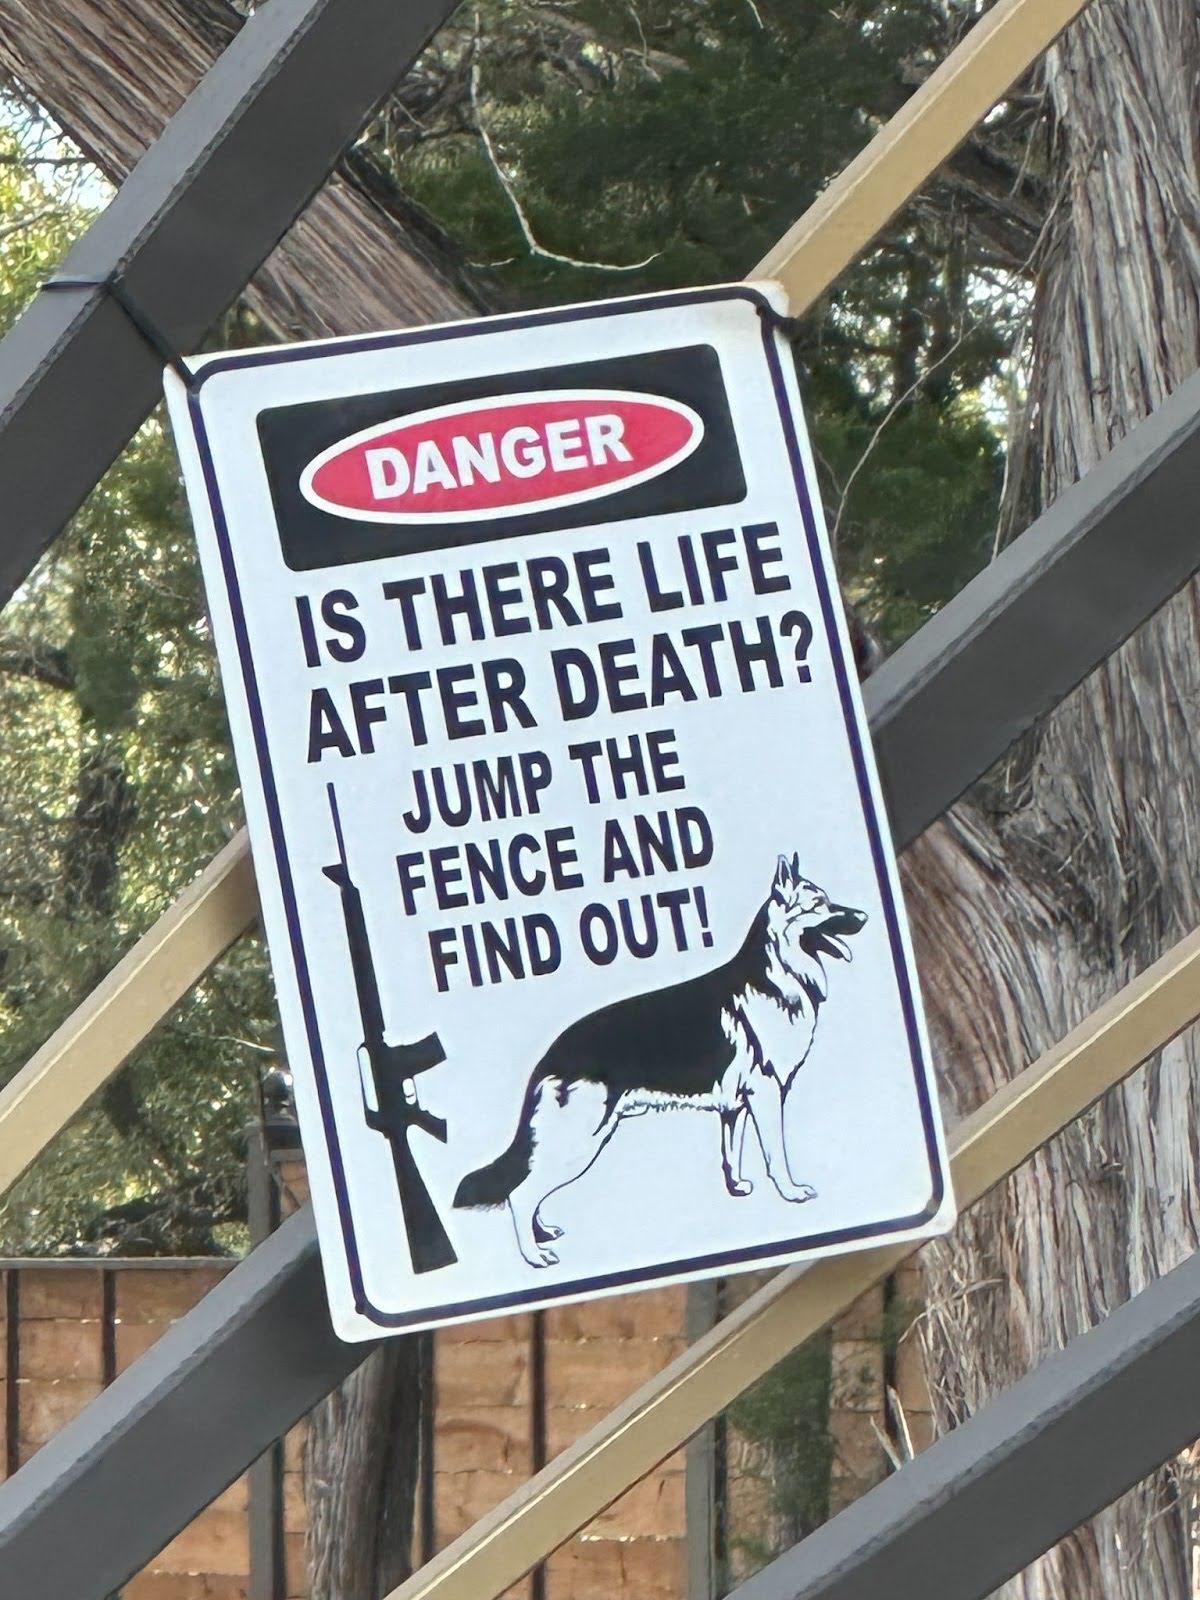
Life After Death Warning Sign
Spotted this sign on a fancy gate in Austin. It’s hilarious, sure—but also a masterclass in persuasive communication. One sentence,...
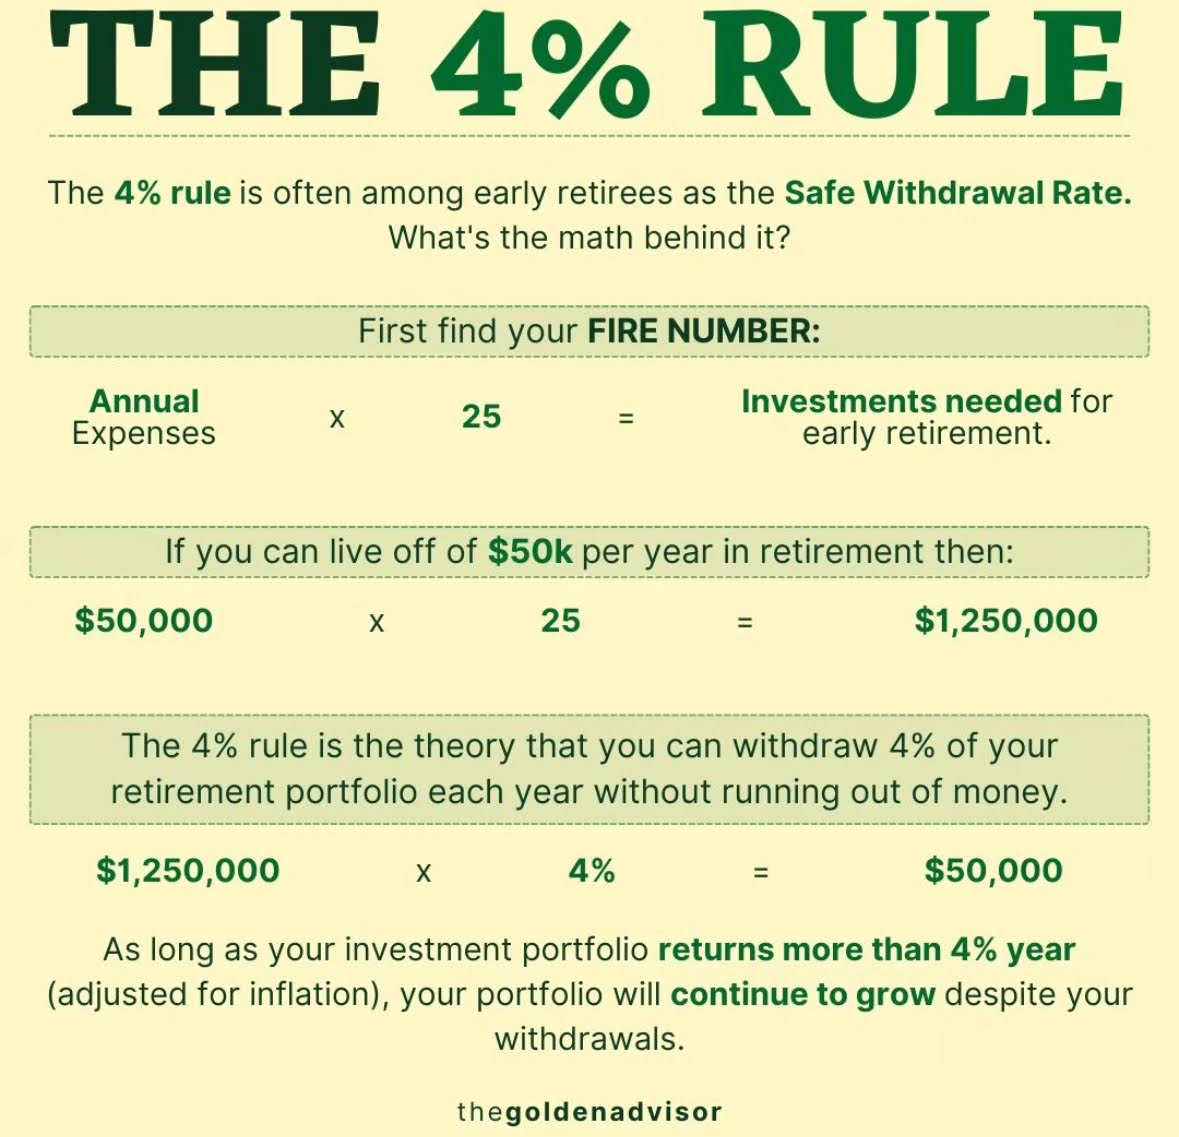
The 4% Rule
This image nails something marketers can steal: taking a complex idea (retirement math) and turning it into one easy formula...

Social Proof Before And After
A simple tweak can completely change how trustworthy your message feels. This image shows how one small edit transforms a...
Arrow Mockup Pool Ad
This Instagram Story from Texas Tiny Pools nails a key marketing trick: educate while showing your product in action. Instead...
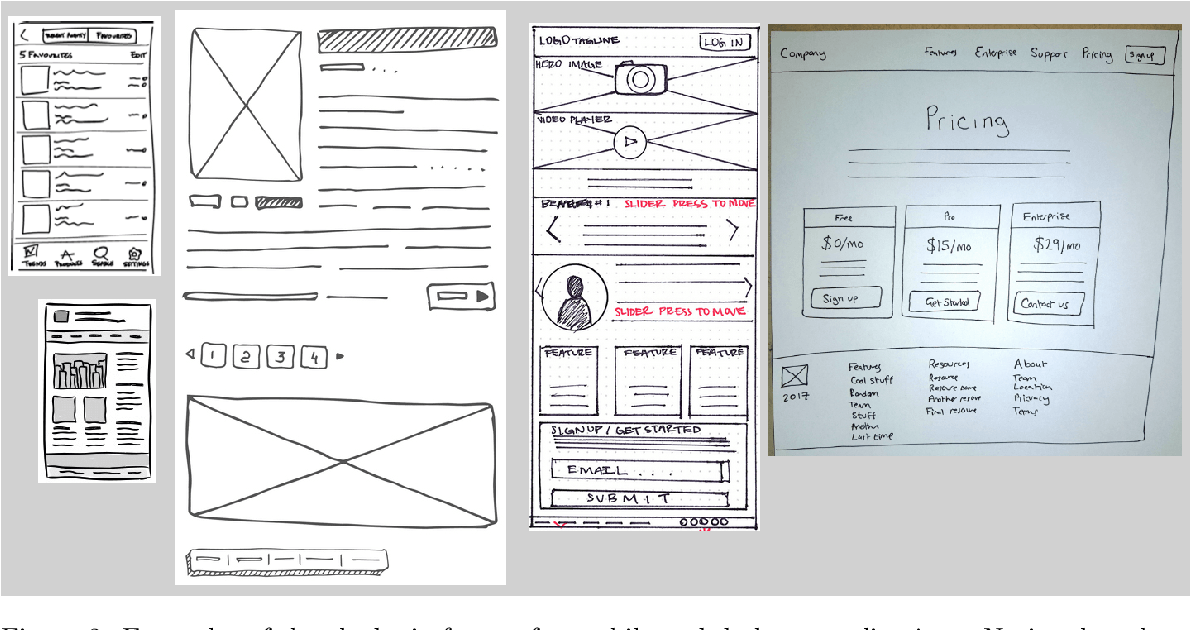
Planning out UI/UX with pen & paper
Designers love Figma, but sometimes the fastest way to fix a messy user flow is by grabbing a pen. These...