Boring industry Excel before/after

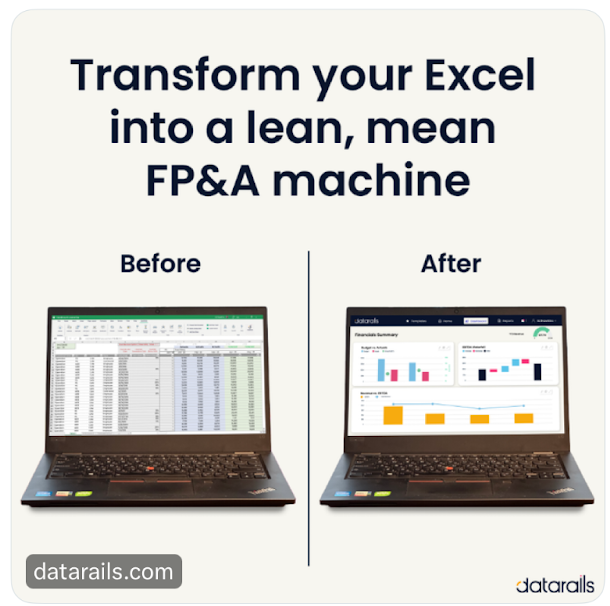
A super simple before & after photos showing with the Datarails product you can go from complicated spreadsheets to a beautiful and easy-to-understand dashboard. 

Before & Afters are great because they tell a complete transformation story in one image.

Visit Link

Bike Visibility in Traffic

I love stuff where your brain just “gets it right away.” This chart shows the top colors to wear for max safety on a bike. You learn something valuable from …

The Learning Pyramid

Learning can take many forms, and some are better than others:

• Lecture: 5% (Average Retention Rate)
• Reading: 10%
• Audio/Visual: 20%
• Demonstration: 30%
• Group Discussion: 50%…

pluto