Great “zoomed out” view of literacy rates data
Updated on
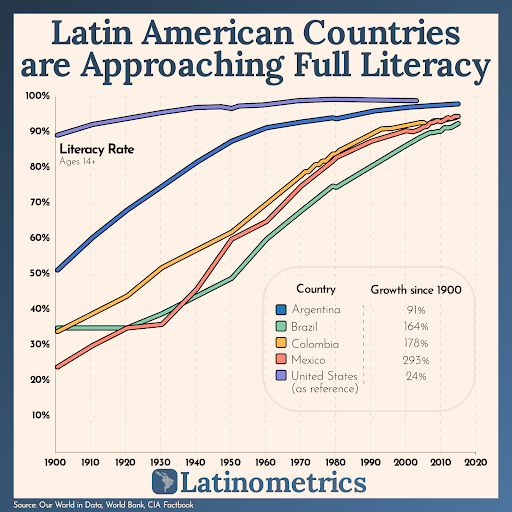
This chart from Latinometrics shows literacy rates in Latin America shooting past 90%. Day-to-day, the numbers don’t look explosive—but zoom out a few decades and it’s a huge win.
The Marketing Lesson
Your marketing data works the same way. Looking at daily sales might discourage you. But zooming out over months or years often reveals powerful progress.
Why It Works
- Progress compounds over time
- Growth looks boring in the short term, dramatic in the long term
- Big-picture data keeps teams motivated and investors confident
Examples
- HubSpot took 5 years to reach $1M ARR, then exploded past $100M
- Morning Brew started with a few friends forwarding an email, now has 4M+ subscribers
- Gymshark grew quietly for years before hitting $1B in valuation
Tiny consistent moves → massive long-term wins.
Analyzed by Swipebot
Loading analysis...