“The Most” of every United State
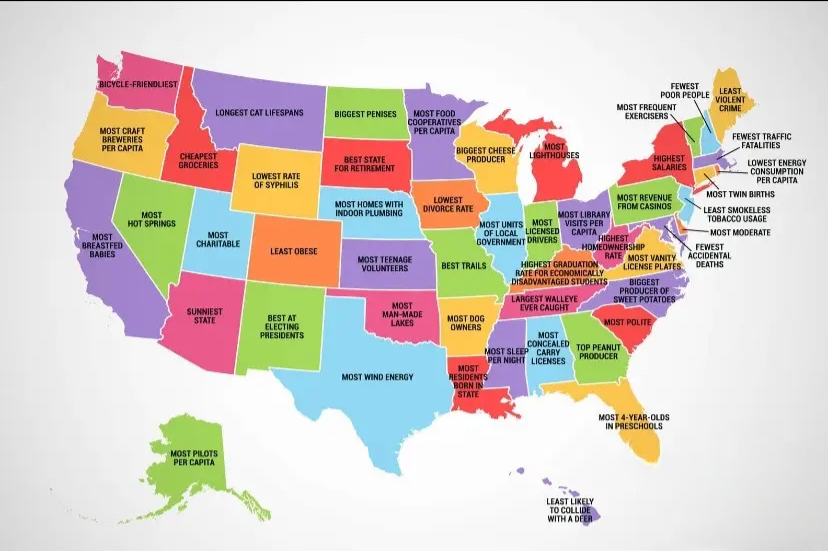
This is a fun graphic with something that each state has the most of.
I’m from Texas: We apparently have a lot of wind energy!
Also this is the kind of image that would be really effective on social media for several reasons:
- Easily Digestible Information: Each state is labeled with a single, standout attribute, making the information quick to read and easy to understand.
- Surprising Facts: Some of the attributes are unexpected or humorous (e.g., “Biggest Poinsettias”, “Most Polite”), which can pique curiosity and encourage sharing.
- Conversation Starter: The map prompts discussions about the attributes of each state, which can lead to debates, stories, and personal experiences related to these unique features.
- Regional Pride: People often feel a sense of pride about where they’re from; this map taps into that sentiment by highlighting a notable feature of each state, which can lead to residents sharing the image.
- Educational Value: There’s an educational component as it informs viewers about various statistical and cultural distinctions across the country.
- Personal Identification: Individuals can identify with their state’s characteristic, which encourages them to interact with the content (likes, comments, shares).
- Humor and Light-heartedness: The map does not take itself too seriously, which aligns with the kind of light-hearted content that people enjoy on social media.
- Shareability: The combination of humor, pride, and colorful design makes this an image people are likely to share, boosting its visibility and effectiveness on social media platforms.
- Broad Appeal: It covers a wide range of topics, from food and lifestyle to economics and social metrics, giving it a broad appeal to different interests and demographics.
This is totally like “social media bait” for sure!