Use images for math formulas

Sometimes in marketing math formulas are used, but they can sometimes be dry or boring.

Instead make them into “Visual Math Formulas” which makes them easier to understand. Here’s 4 examples:
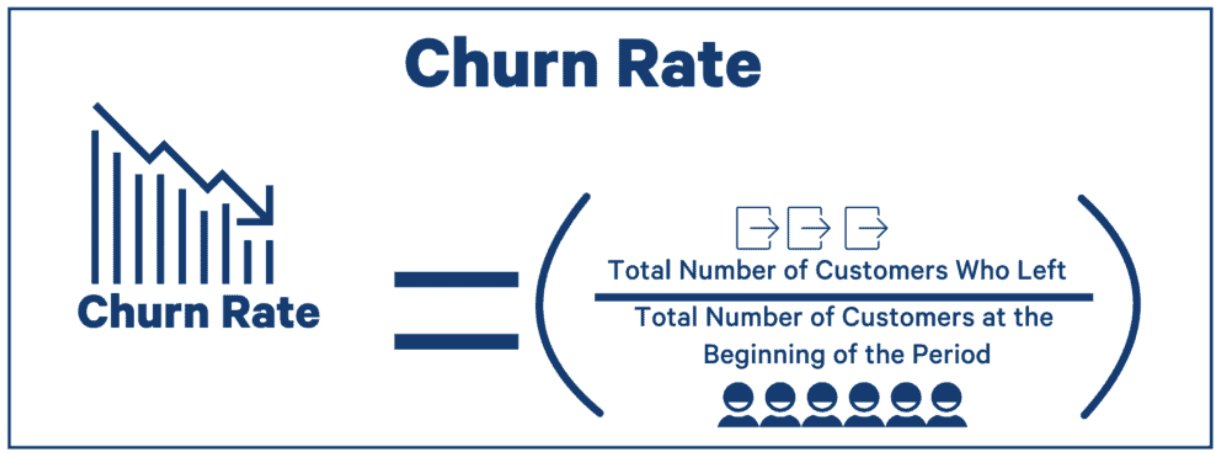
– Churn Rate
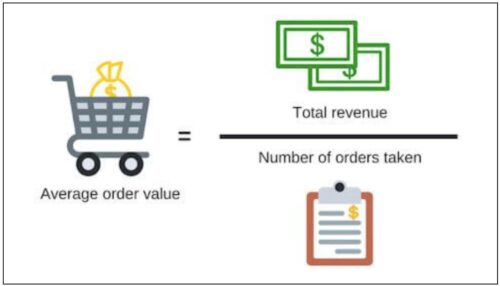
– Average Order Value
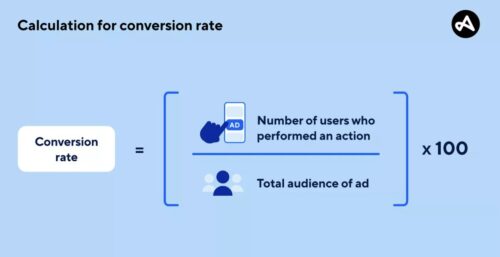
– Conversion Rate
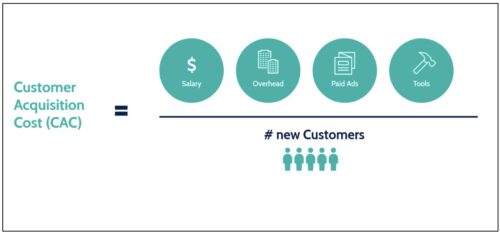
– Customer Acquisition Cost

pluto

Q2 is near

Whatever your 2024 goal is, you have 9 more months to complete it

❌ Q1: January, February, March​
✅ Q2: April, May, June
✅ Q3: July, August, September
✅ Q4:

Total Addressable Market

When looking at market size it’s helpful to look at the realistic amount you can capture.

TAM: Total demand for a specific product/service in a market.

SAM: Portion of TAM