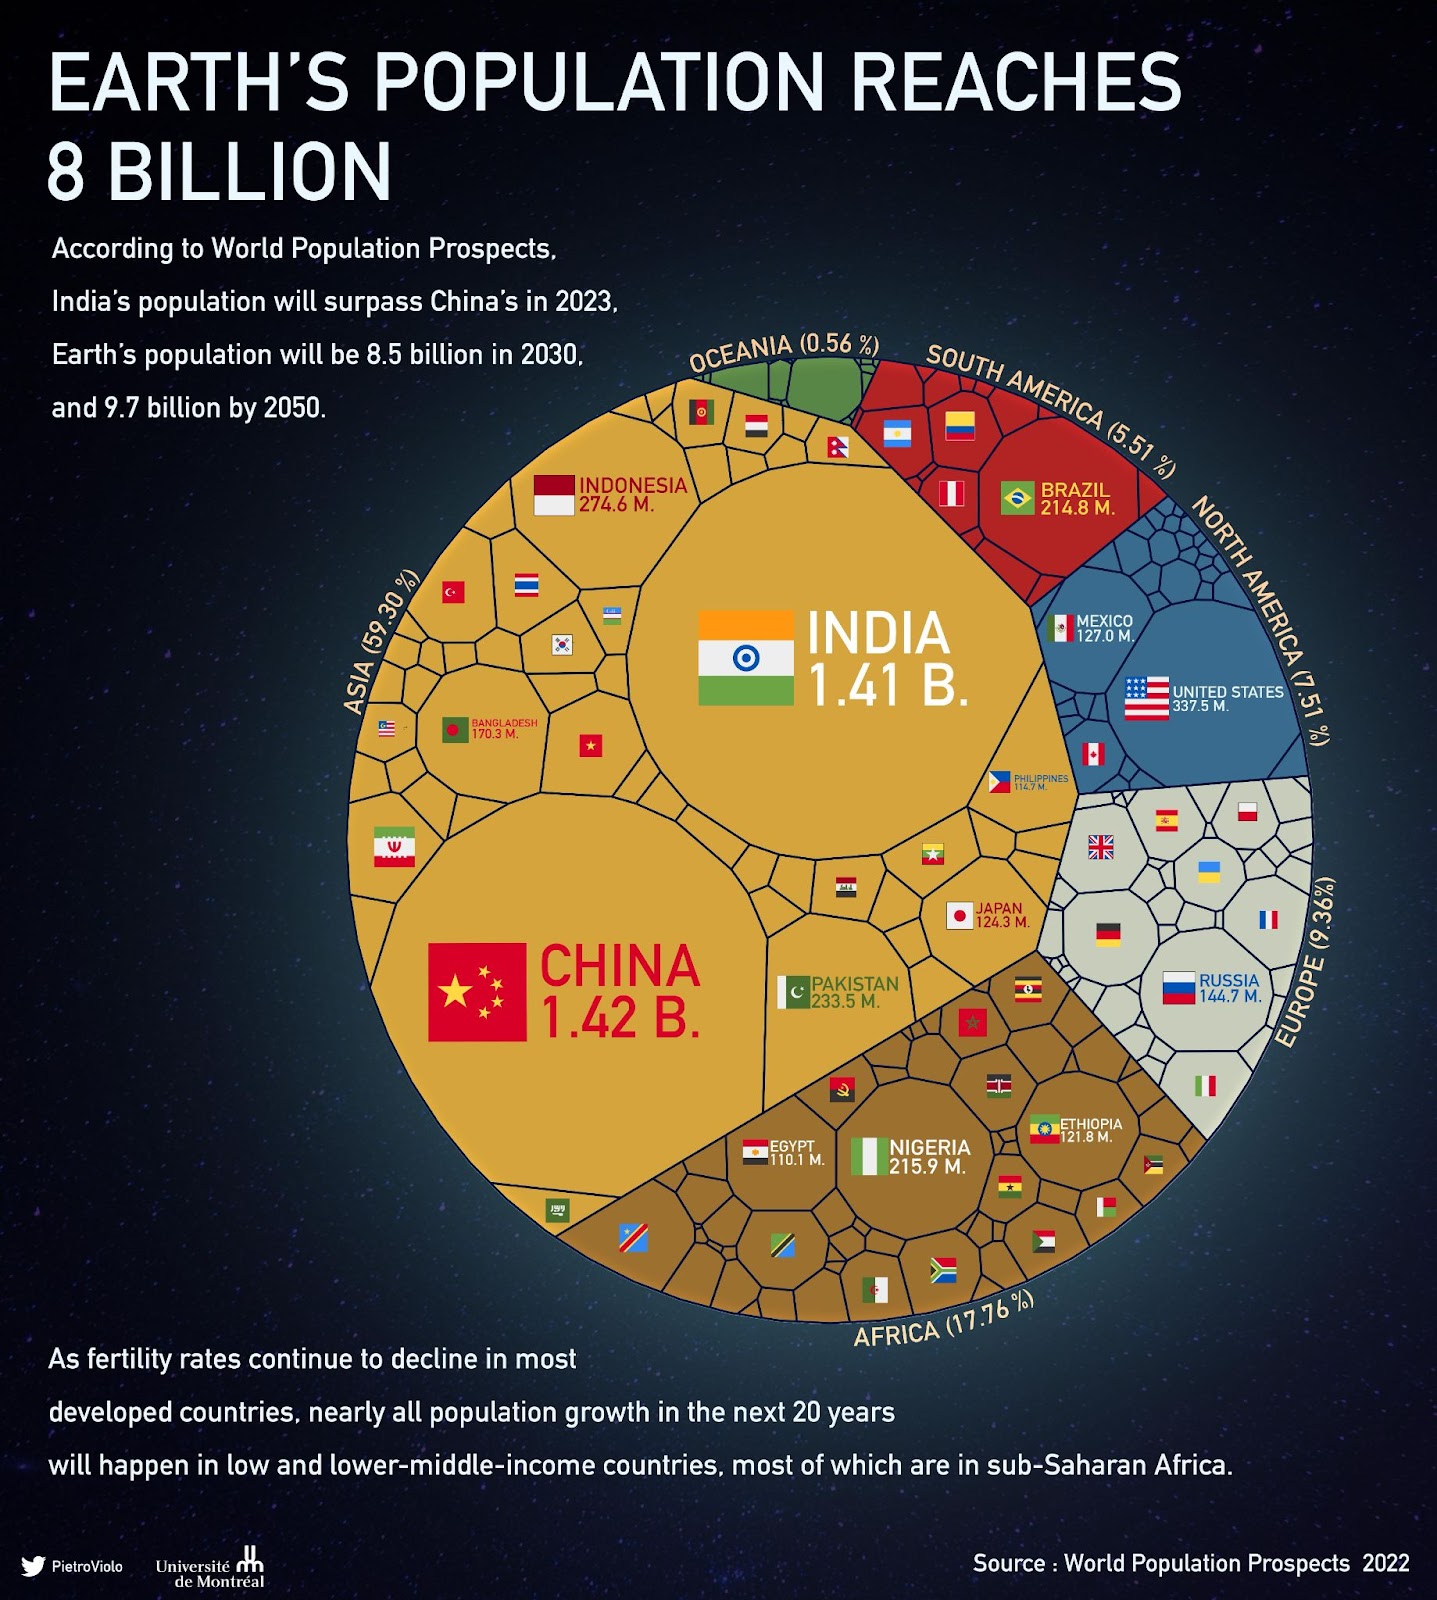
Visualization of Earth’s population

When visualized out proportionally, the United States and North America combined look shockingly small.

If this was shown in raw data points it wouldn’t make much of an impact, but this visualizations displays the data so much better!

Visit Link
Q2 is near

Whatever your 2024 goal is, you have 9 more months to complete it

❌ Q1: January, February, March​
✅ Q2: April, May, June
✅ Q3: July, August, September
✅ Q4:

pluto

Total Addressable Market

When looking at market size it’s helpful to look at the realistic amount you can capture.

TAM: Total demand for a specific product/service in a market.

SAM: Portion of TAM