Cool graph shows time to launch a product, get a customer, and product market fit
Updated on
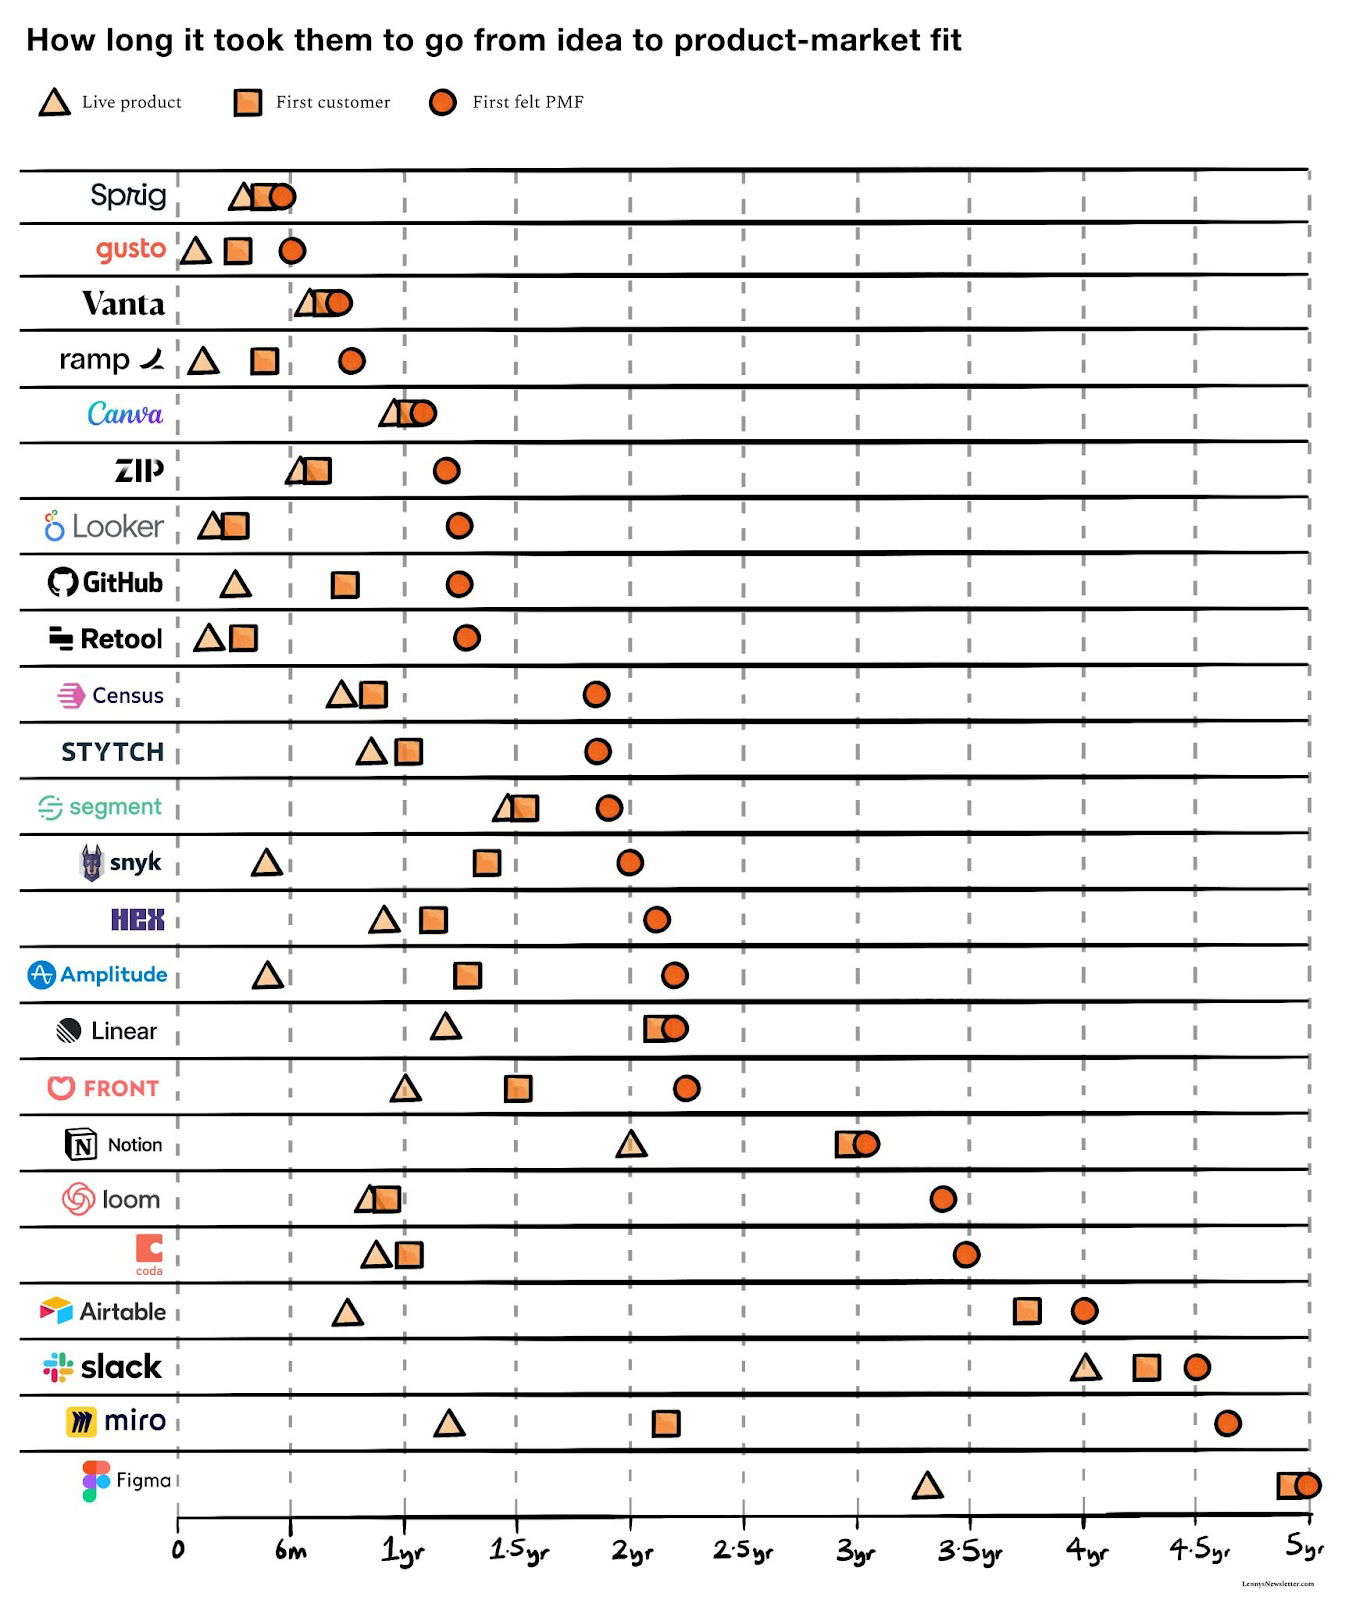
Here’s a wild one: a chart showing how long it took top startups to launch, get their first customer, and hit product-market fit. But the real gold isn’t the data—it’s how people look at it.
Marketing analysis
The eye-tracking overlay shows people first scan the upper-left (fastest-growing startups), then bounce down and right (slower ones). It’s proof that visuals guide how we “read” data—our eyes crave patterns, clusters, and movement.
Why it works
- Simple chart + clear symbols = instant comprehension
- Contrast directs attention without words
- People process visuals 60,000x faster than text
- Sequential design makes the story easy to follow
Examples
- Apple’s “Shot on iPhone” visuals: immerse first, explain later
- Spotify Wrapped: data turned into colorful, sharable graphics
- Airbnb’s market slides: minimal text, high visual storytelling power
Analyzed by Swipebot
Loading analysis...