How VC’s analyze investments.
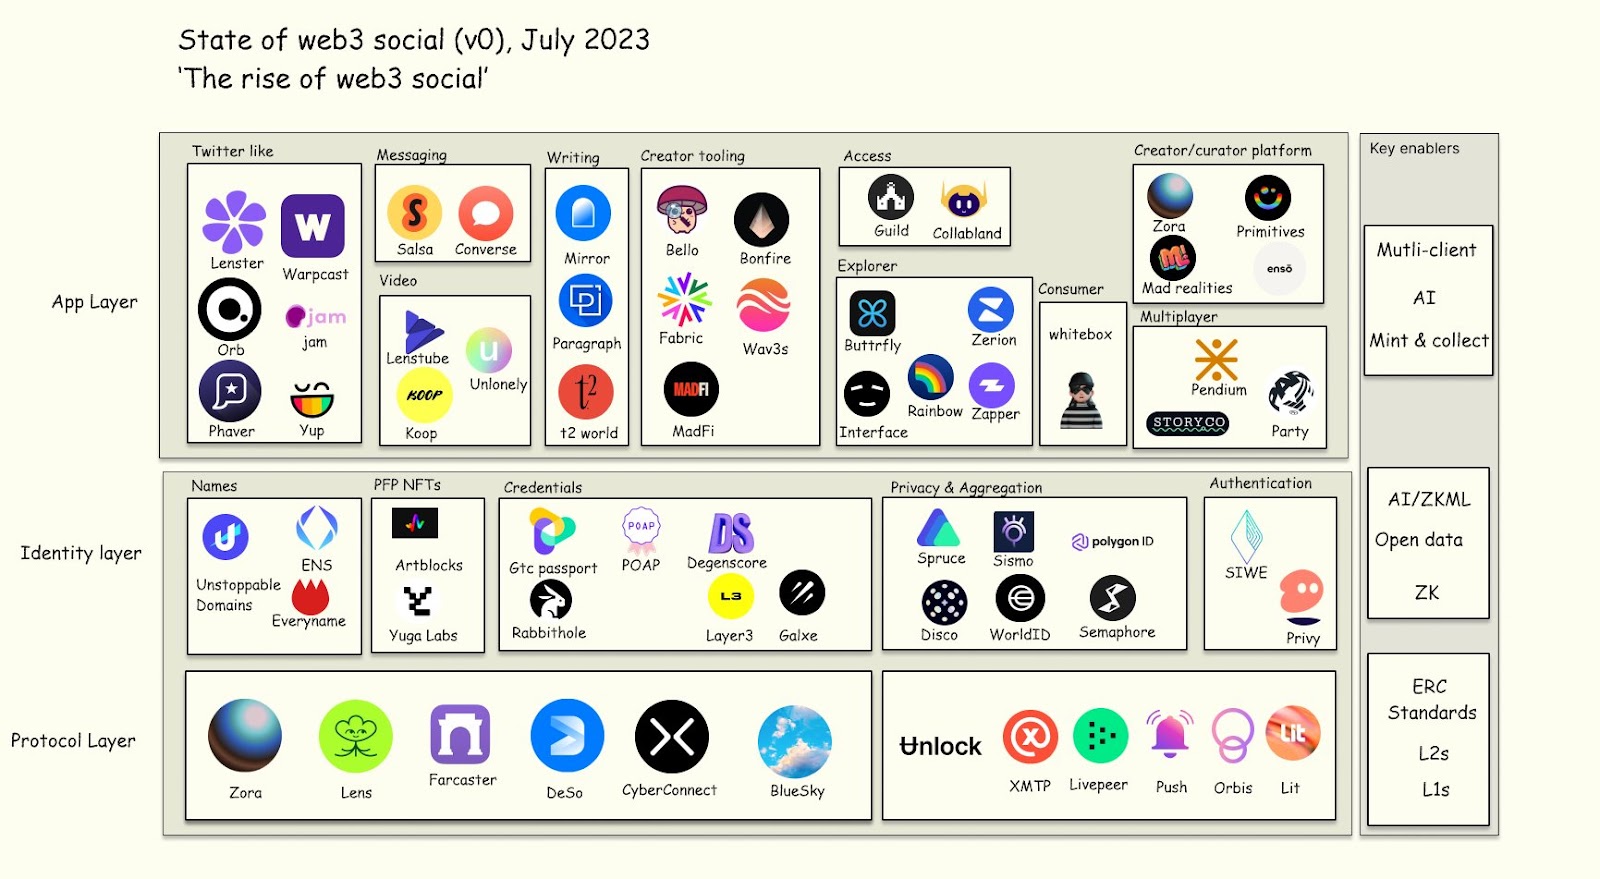
This graph categorizes different companies and where they stand in an industry-wide grand scheme of Web3.
Looking at an industry like this helps see which companies rely on others, and who has the biggest moat.