Thai spiciness level visual chart

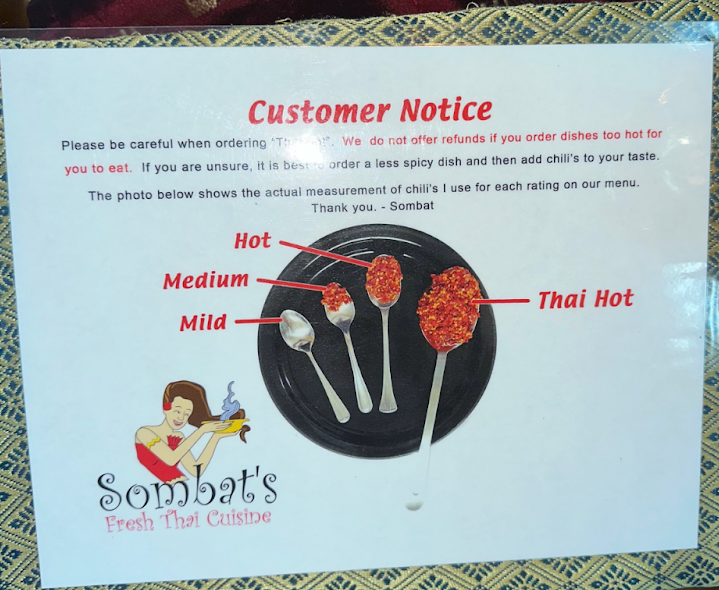
We’ve all ordered “spicy” at a Thai restaurant only to realize it’s TOO SPICY. This helpful chart shows people that even small increases in chili can be vvveerry hot.

This simple chart probably saves the restaurant hundreds of complaints a year of their food being “too spicy!”

Visit Link

Q2 is near

Whatever your 2024 goal is, you have 9 more months to complete it

❌ Q1: January, February, March​
✅ Q2: April, May, June
✅ Q3: July, August, September
✅ Q4:

pluto

Total Addressable Market

When looking at market size it’s helpful to look at the realistic amount you can capture.

TAM: Total demand for a specific product/service in a market.

SAM: Portion of TAM