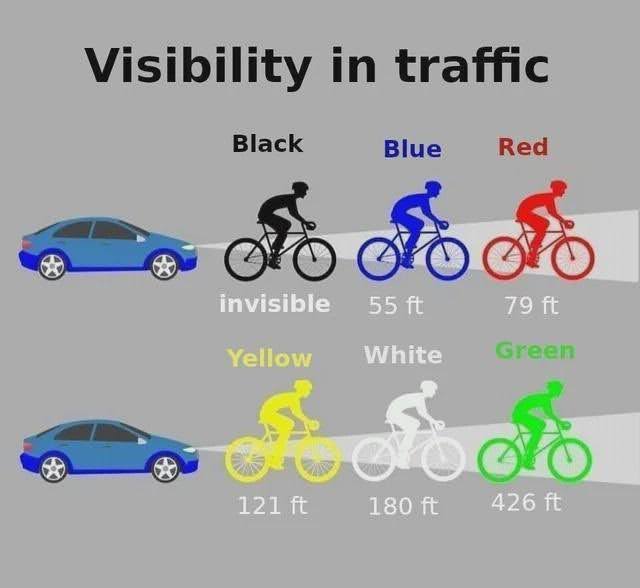
Disney’s business strategy infographic (1957)

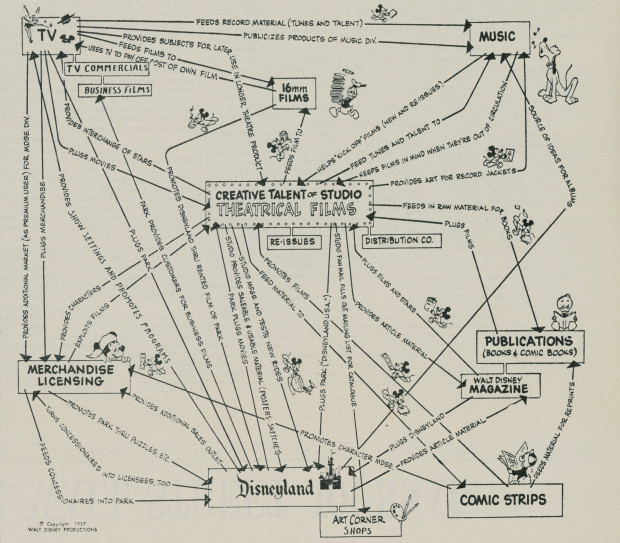
This isn’t the *neatest* diagram, but it’s a pretty cool one.

It’s a breakdown of Disney’s business strategy from 1957. It connects all the different aspects of Disney, from amusement parks to comic books, music, tv, and movies.

These weren’t just separate projects, they each had a purpose and fed into one another.

Visit Link

Bike Visibility in Traffic

I love stuff where your brain just “gets it right away.” This chart shows the top colors to wear for max safety on a bike. You learn something valuable from …

The Learning Pyramid

Learning can take many forms, and some are better than others:

• Lecture: 5% (Average Retention Rate)
• Reading: 10%
• Audio/Visual: 20%
• Demonstration: 30%
• Group Discussion: 50%…

pluto

How couples meet graphic

WOW. Look how rapidly online dating became the primary way couples meet.

I meet people who don’t like using dating apps, but by the math of it, it’s almost FOOLISH …